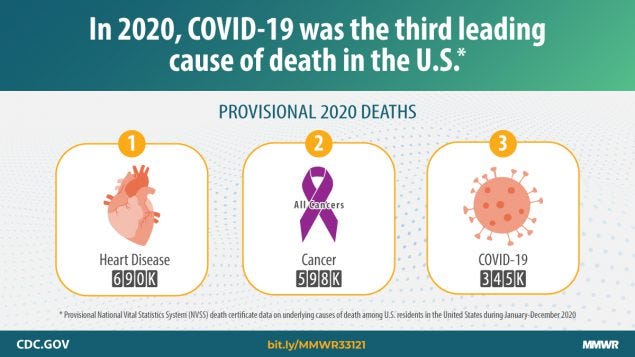
Back in March 2020 (actually I think my first prediction was in April 2020), public health officials hypothesized that COVID19 would be the third leading cause of death in the United States. We were able to make this guess based on transmission projections and fatality rates across the globe. We thought we had to wait until 2022 to officially know whether this was correct.
Why the delay?
The CDC has a division called the National Center for Health Statistics. Within that division is the National Vital Statistics System (NVSS) who publishes the most comprehensive birth and death information in the United States. Every year, NVSS is in charge of investigating and summarizing causes of death. As you can imagine, it typically takes NVSS a long time (i.e. 11 months) to swift through millions of death certificates and to process and review data. But, if the pandemic has taught us anything, it’s that we can streamline bureaucratic processes for more timely results. Last week, NVSS released provisional mortality numbers for 2020.
What does “provisional” mean?
This basically means that winter mortality data is incomplete and these numbers will slightly change. But, this is the best, most complete picture we have right now.
What did they find?
In 2020, 3,358,814 deaths occurred in the United States. This is 15.9% higher than expected
11.3% of deaths (377,883) listed COVID-19 as the underlying cause of death or a contributing cause of death
COVID19 was the third leading cause of death in 2020
Importantly, deaths for which COVID-19 was a contributing, but not the underlying, cause of death are not included in these figures
Impact of the pandemic on other causes of death
I was most interested was how other causes of death changed because of the pandemic. For example, did suicides increase because of increased financial strain? Did motor vehicle crashes decrease because of lockdowns? This is the first time that we’ve gotten a glimpse of these numbers.
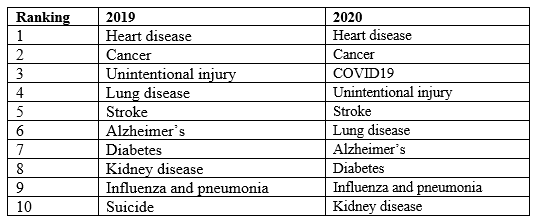
I created a Table outlining the 10 leading causes of death in 2019 (using data from HERE) and 2020 (using data from HERE).
Raw numbers might have changed (we don’t have access to the raw 2020 data yet) and some of the categories switched places (which is normal), but the overall categories or order of the categories didn’t meaningfully change due to the pandemic. Which is fascinating.
Even more detail
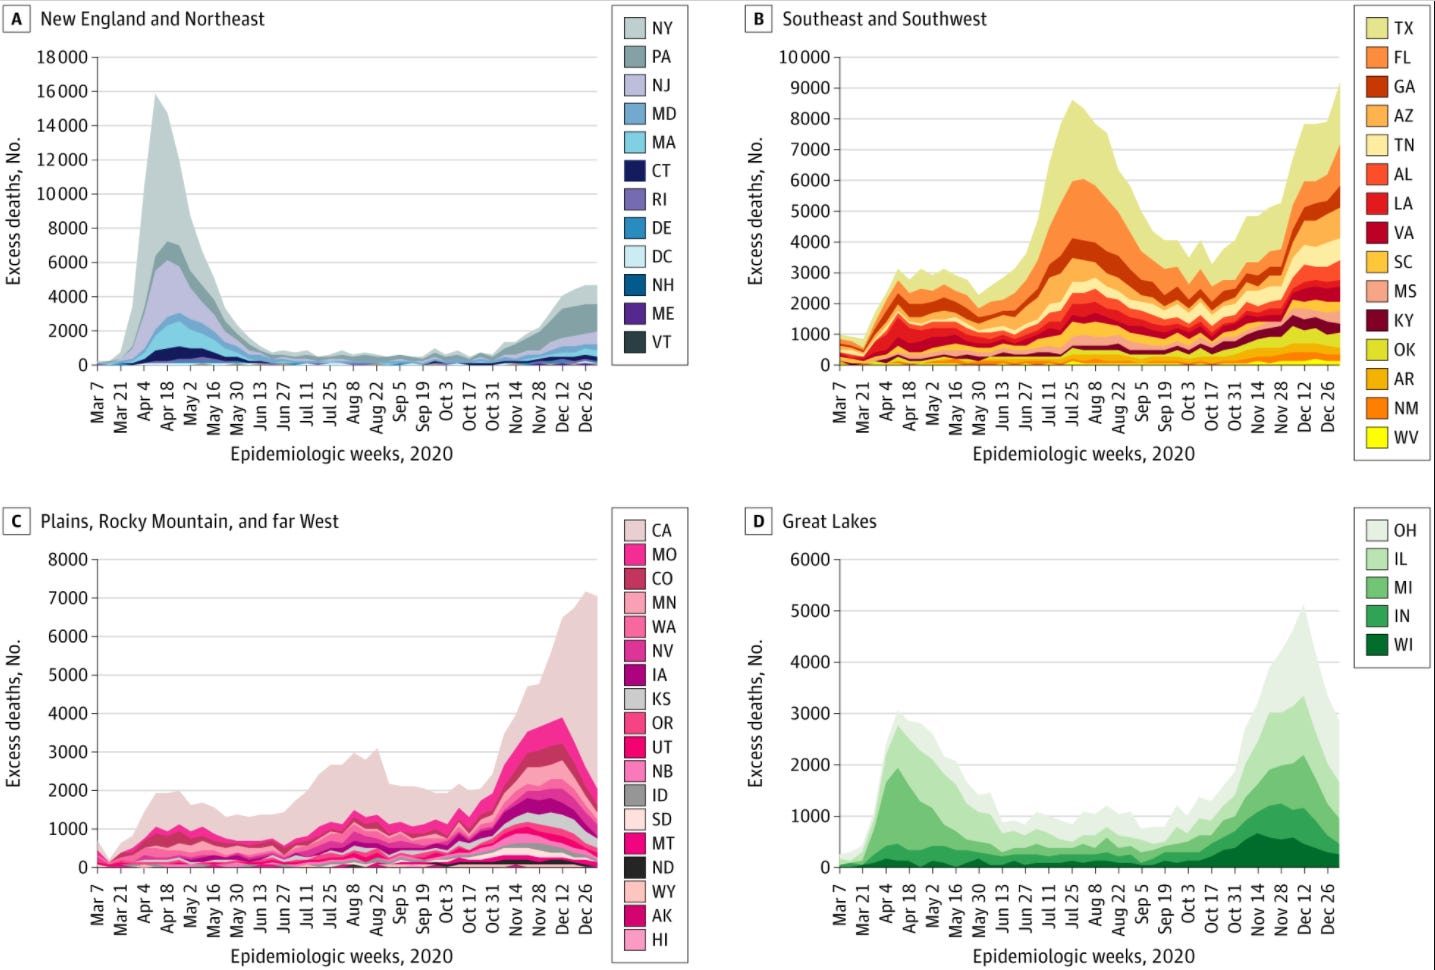
Another scientific study also recently published excess death data. The numbers don’t exactly match up with the CDC study because the two studies measured slightly different things. But they found a similar “story”:
Of excess deaths, 72.4% of them were due to COVID19
The 10 states with the highest per capita rate of excess deaths were: Mississippi, New Jersey, New York, Arizona, Alabama, Louisiana, South Dakota, New Mexico, North Dakota, and Ohio.
The U.S. experienced four excess death surge patterns, dependent on geography (see Figure)
Long story short: COVID19 is not something to mess around with. Get your vaccine.
Love, YLE


according to the table in 2019 suicide was number 10. In 2020 suicide did not make the list. Is this correct? I thought suicides were up in 2020 because of the psychological effects of isolation and sheltering in place.