
Current state of affairs: July 12
Current state of affairs: July 12

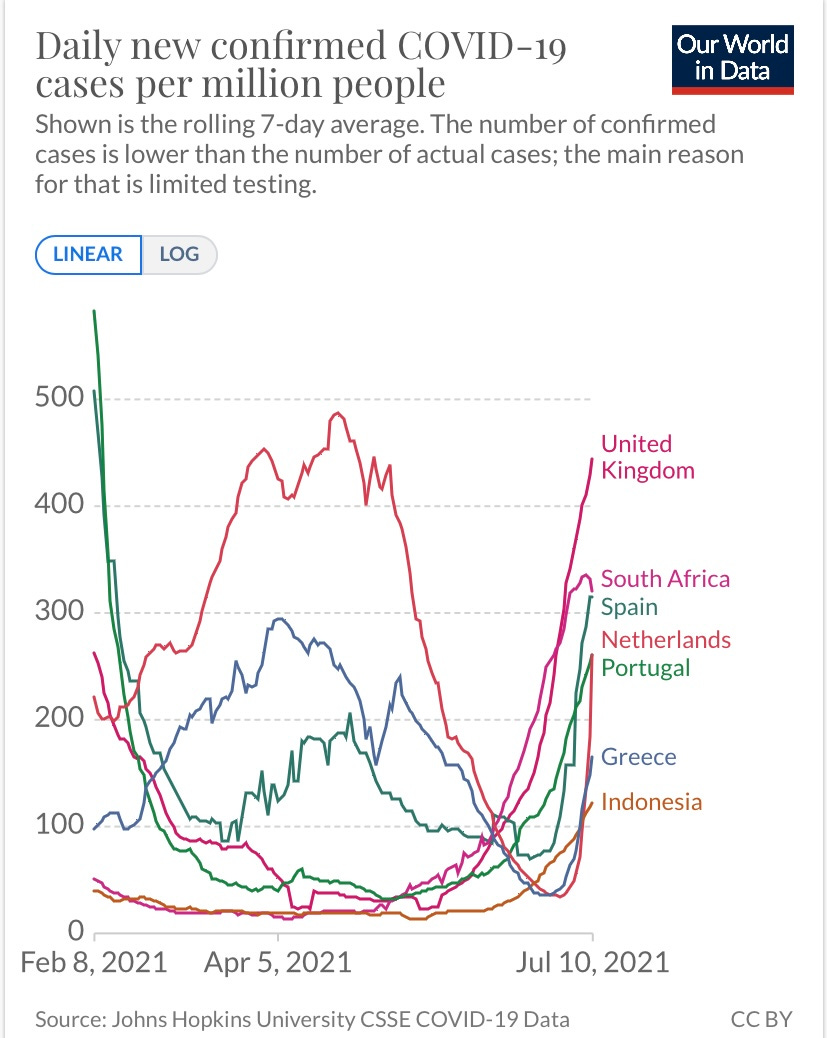
Over the weekend, the WHO said that there are 24 countries that have “epidemic curves that are almost vertical now”.
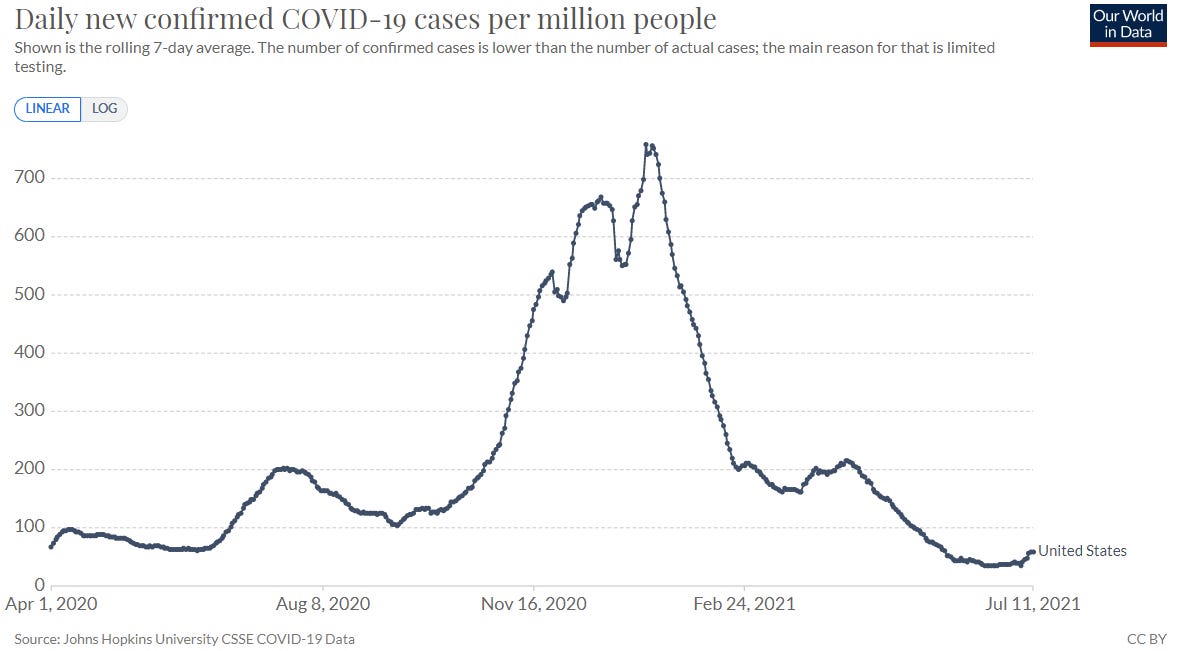
So, how is the U.S. doing?
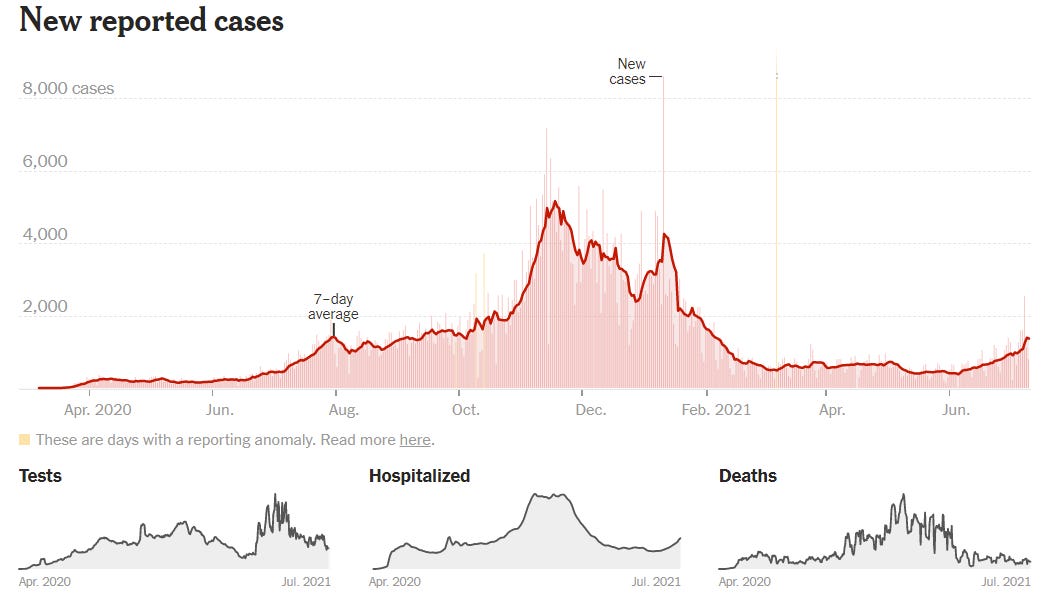
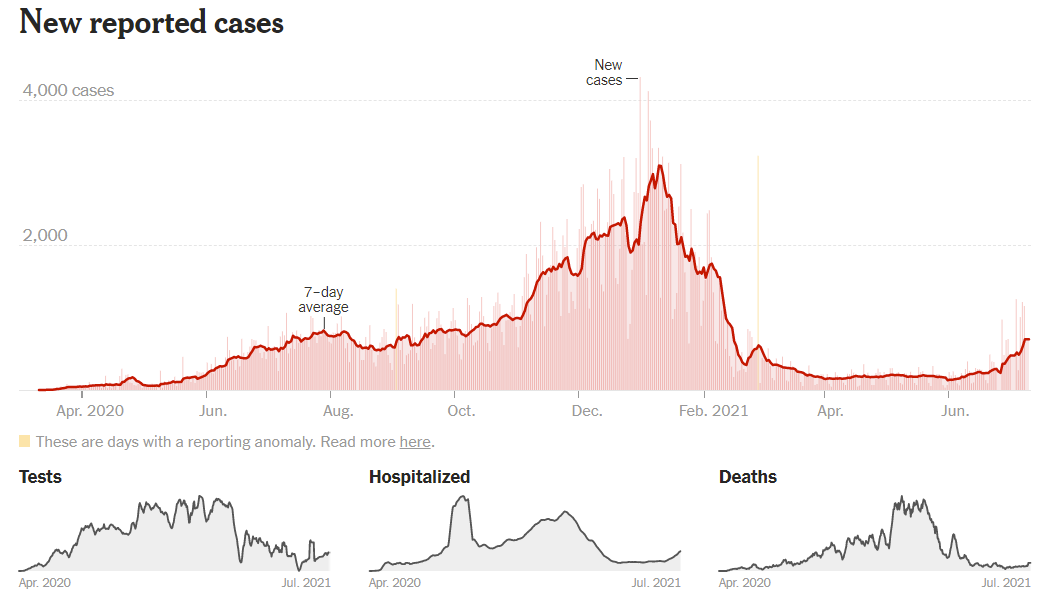
Cases are up 16% from last week and, as a nation, we don’t have a clear vertical incline yet. There is a small blip in our epi curve.
On a state-level, the current state of affairs dramatically ranges. Here is a map of the transmission levels that take into account cases and test positivity rate (TPR). Five states have a high level of transmission (red); 5 states have substantial transmission (orange); the majority of states have moderate transmission (yellow). 5 states have low transmission (blue).
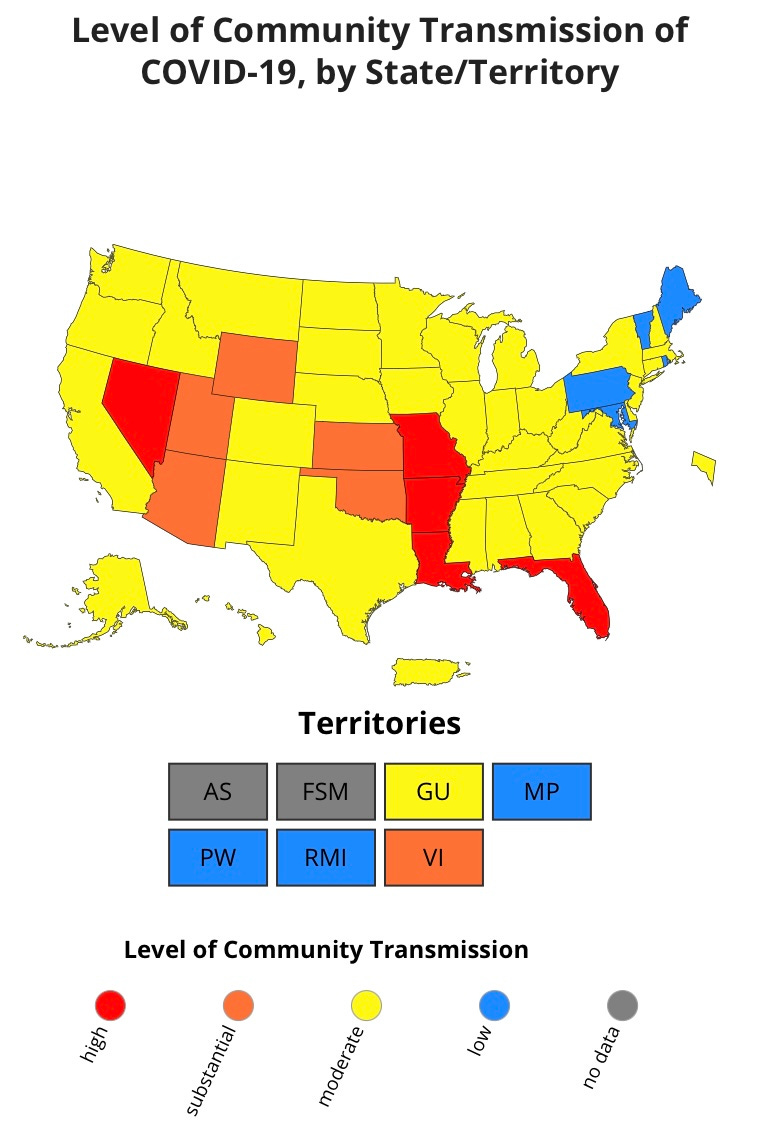
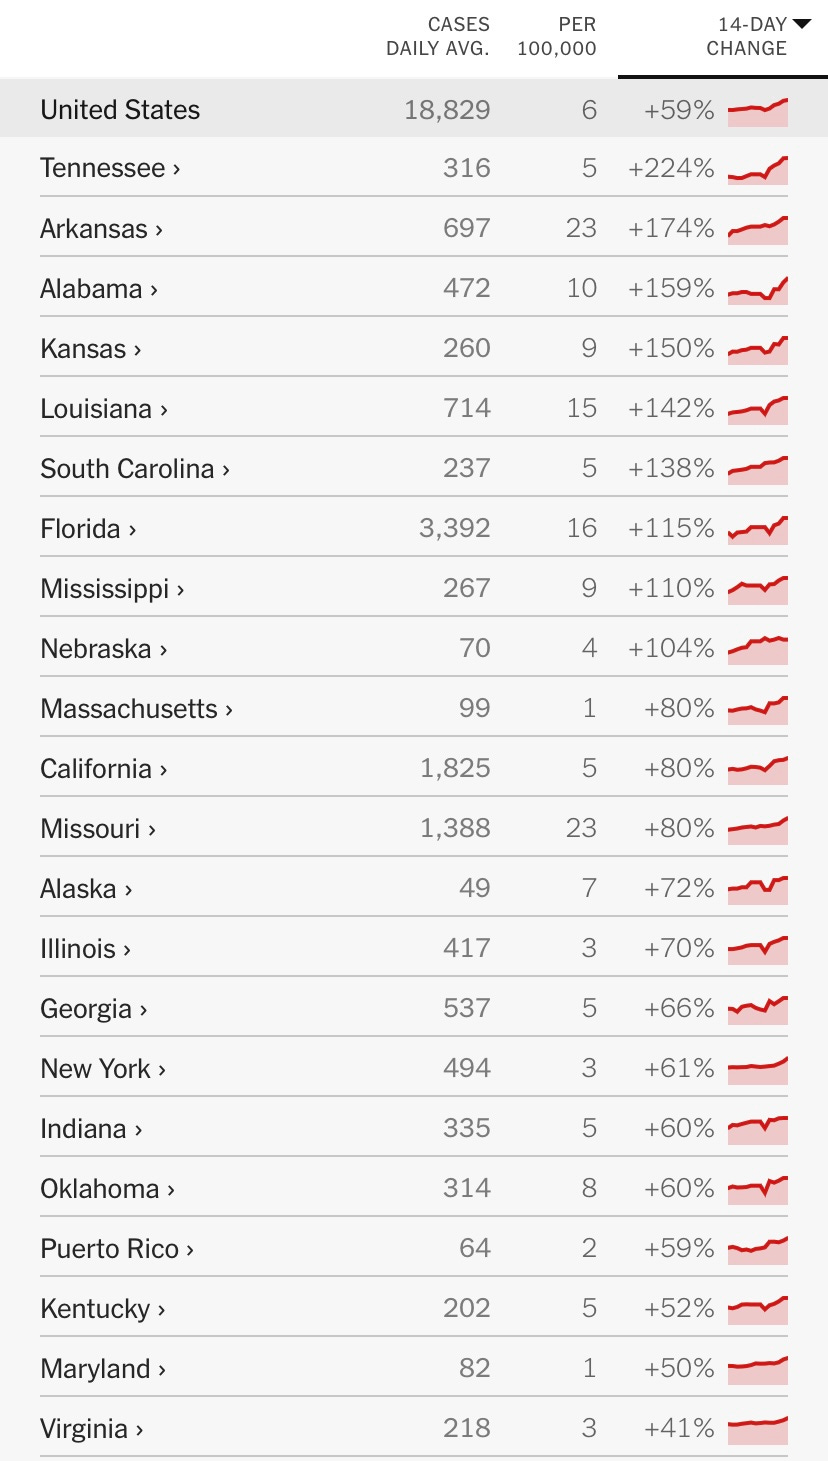
Among the red transmission states, things look bad. In Missouri (40% fully vaccinated) and Arkansas (35% fully vaccinated) cases are continue to increase exponentially. As with the rest of the pandemic, hospitalizations are following a ~3 week lag.
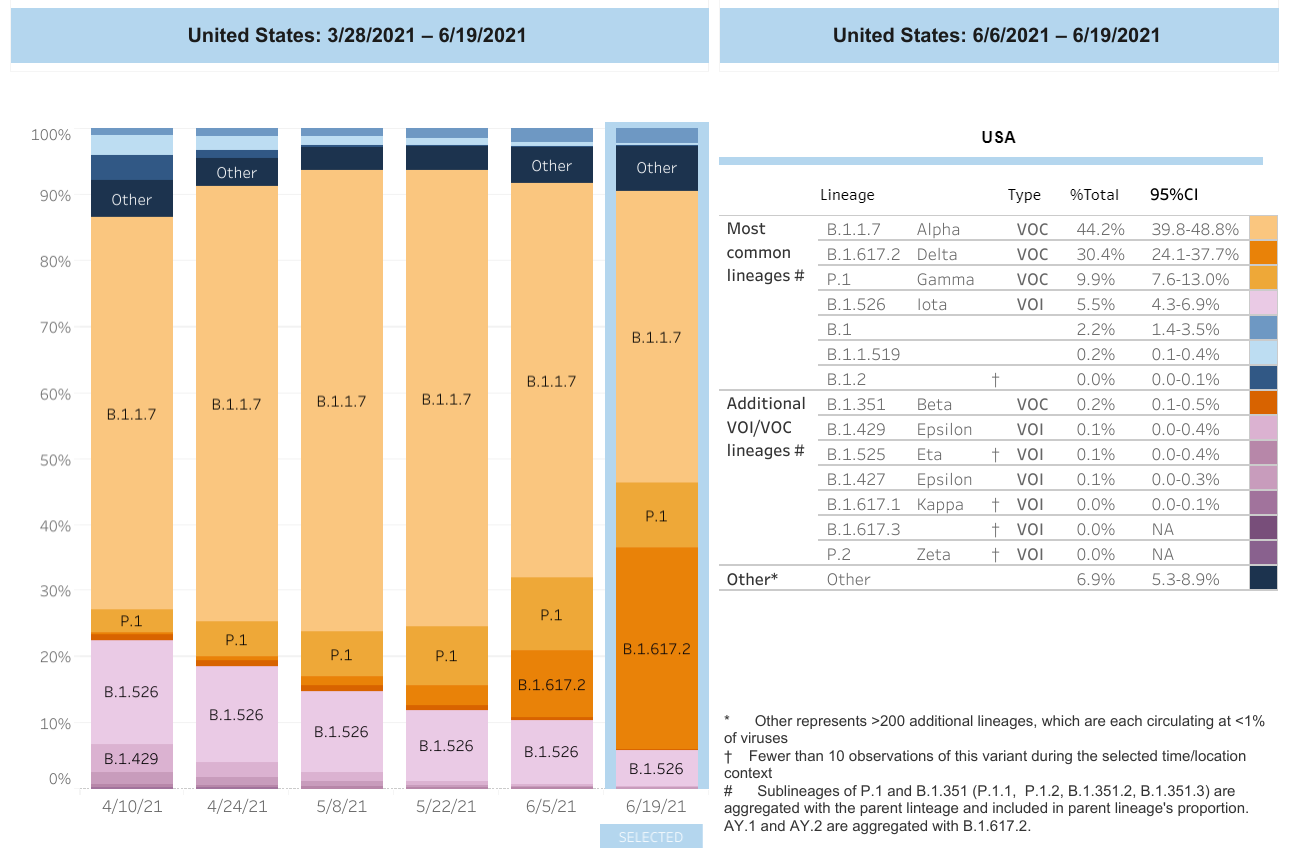
And this is no doubt because of a one, two punch: Low vaccination rates coupled with Delta (B.1.617.2). Delta continues to gain speed and is quickly taking over Alpha (B.1.1.7). But, this too is differentially spread throughout the United States. For example, in Health Region 7 (Missouri, Nebraska, etc), Delta makes up 70% of cases. In Health Region 3 (Delaware, DC, etc), Delta makes up 10% of cases. Because of this, we will see unique regional case trends.

There are two things to pay attention to in the upcoming weeks.
First, test positivity rate (TPR). TPR is typically a good indicator of what will come. We want a TPR that doesn’t climb above 5%. As a nation, our TPR is increasing and increasing fast.

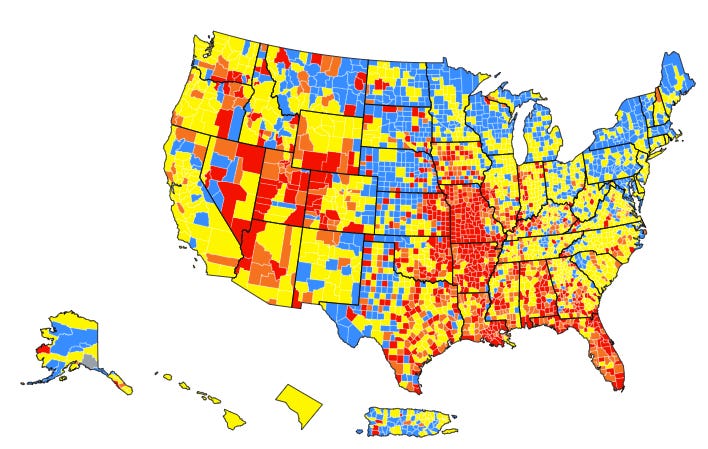
Second, we need to pay attention to the rate in which cases are increasing. This is usually best looked at using a “log graph”. The map below isn’t raw number of cases over time. Instead it’s showing how quickly those cases are increasing or decreasing. As a nation, our cases seem low right now, but they are quickly gaining speed. In fact, it looks like an even steeper incline compared to the beginning of our first, second, or third waves.

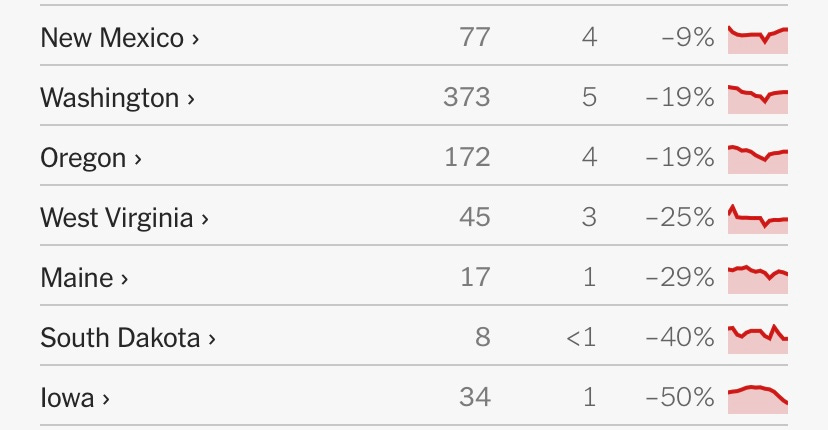
We can also see this on a state-level. For example, Tennessee has a moderate transmission rate right now…5 daily cases per 100,000. However, its case count is increasing at a dramatic rate: 225% in the past 14 days. Only 12 states have decreasing trends.

Bottom Line: This is certainly not an Alpha (B.1.1.7) situation where only a few states (Oregon and Michigan) and a handful of counties are increasing. This is widespread, which is mind-blowing given that we have a viable, highly effective solution right now- vaccines! This should be interesting to follow this week and the upcoming weeks.
Have a wonderful Monday, YLE
Thank you for color blind friendlier maps! My husband often comments about how frustrating graphs and charts can be to interpret (he's red/green colorblind). Other than the orange and red tones being close, he could accurately see/interpret the maps.
I saw a comment on Facebook where you said Pfizer and Moderna will be pursuing full approval for kids 11 and under. Does that mean vaccinations for kids will not be in the fall, but years from now?