Excess Deaths
Tracking the mortality impact of COVID19 is difficult. Real-time data is messy and there are vast differences in reporting across states. Critics have raised concerns that deaths not caused by the virus are improperly counted as COVID19. To account for this, epidemiologists started assessing “excess deaths”. In other words, how many “extra” deaths do we have in 2020 compared to the same time period in 2019?
The first “excess death” analysis I saw was in March conducted by epidemiologists in Europe at EuroMono. Following this, a research group in Yale worked on US data and published on July 1 in JAMA. They have continually updated the data since. This post leverages updated US data: excess deaths between March 1-June 27.
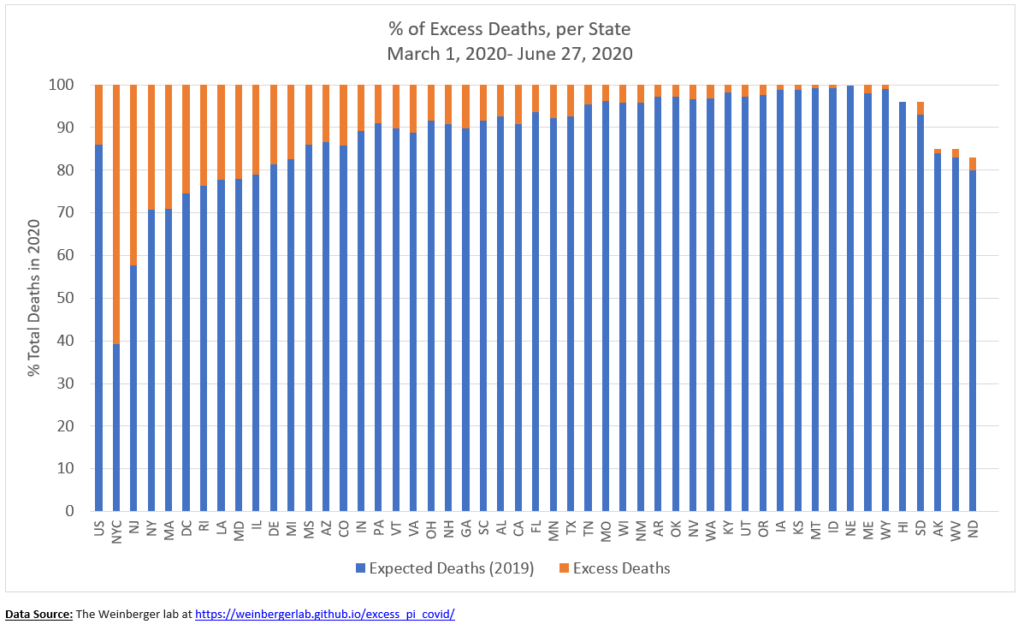
The majority of states have excess deaths in 2020 compared to 2019. For example, NJ: there were a total of 40,492 deaths from March 1-June 27, 2020. We expected 58% (23,400) of those deaths according to last year, but 42% (17,200) of the deaths were not expected.
Surprisingly (at least to me), there are 6 states that don’t have excess deaths in 2020: NE, HI, SD, AK, WV, & ND. In fact, they have FEWER deaths in 2020 than in 2019. This could be due to a decline in other categories of deaths, like car crashes.
Figure 2 categorizes excess deaths: COVID19, influenza/pneumonia, and other. So, in NJ, among the 17,200 excess deaths from March 1-June 27, 78% were due to COVID19 (green), 0% were due to influenza/pneumonia (light blue), and 22% were other/unknown (yellow).
The other/unknown (yellow) can be due to: 1) other deaths that have increased because of the pandemic (think suicide, delaying medical care); 2) deaths due to COVID19 but death certificate analyses delayed; or 3) deaths due to COVID19 but were never tested. Nonetheless, the authors of the paper concluded, “Official tallies of deaths due to COVID-19 underestimate the full increase in deaths associated with the pandemic in many states.”
Data is through June 27. As more time passes in the new surge, it will be interesting to see how these numbers continue to change.
Love, your local epidemiologist
Important notes:
-Connecticut and North Carolina were missing mortality data and therefore excluded. I did not forget about them
Data Sources:
-Data from 2019 was pulled from the CDC National Center for Health Statistics
-Graphs were created by me using data from the Weinberger lab for ease of distribution on social media.
-Here is the EuroMono group website: https://www.euromomo.eu/graphs-and-maps
-JAMA article: https://jamanetwork.com/…/jamainternalm…/fullarticle/2767980
-The Weinberger lab: https://weinbergerlab.github.io/excess_pi_covid/


