
National (U.S.) Update
Your national (U.S.) update as of Feb 3 at 8:00PM CST
Cases... continue to plummet. There's no doubt that the 2020 holiday season caused a surge in cases. Which is consistent with what we saw on Memorial Day and July 4. The impact that human behavior, like the 2020 holiday season, has on human life is really quite fascinating. Anyways, our 7-day average is now the same as it was on November 12. Today, 42 states have a decreasing 7-day average of cases and 8 states are plateauing. Only Texas has an increasing 7-day case rate (11%).

Testing...is continuing to plateau, which isn’t necessarily bad. Especially if cases continue to decrease. Because this means that test positivity rate will be decreasing. Which is fantastic. We want TPR<10% (<5% is ideal) to get a handle on transmission.
Hospitalizations....are tanking too. Hospitalization trends follow case trends, so this makes sense. Hospitalizations in 41 states are decreasing, 9 states are plateauing, and 1 states is increasing (Vermont=15%). This is also fantastic news. But, remember, decreasing is relative. They are decreasing from the highest peak we’ve every experienced. Today, 91,440 people were on hospital beds for COVID19. This is still higher than the peak in April (59,779 hospitalizations) and July (59,718 hospitalizations).

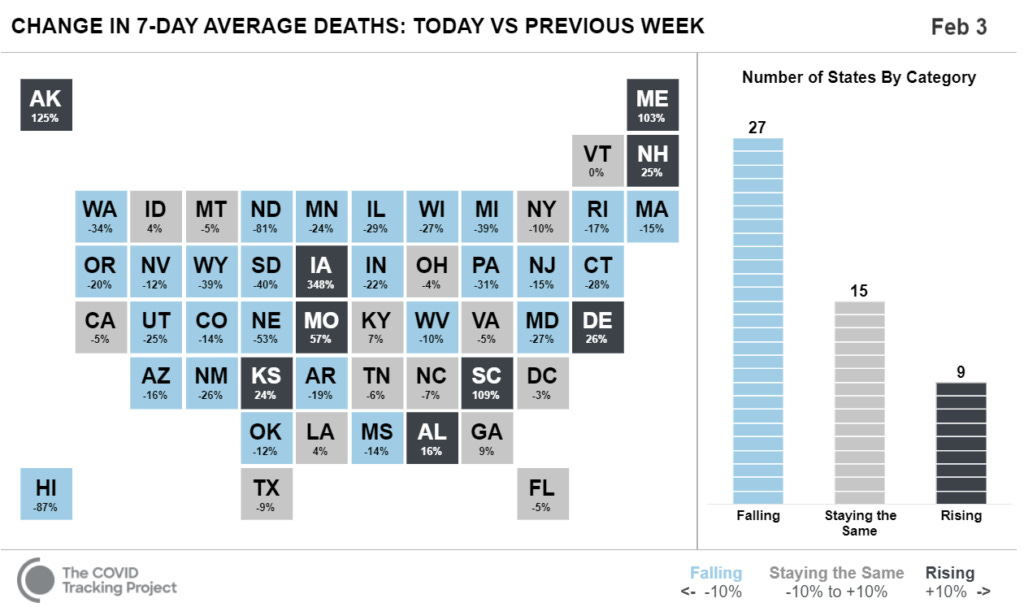
Deaths...are increasing but significantly losing momentum. In other words, we should see our peak here soon (if it wasn’t today or yesterday). 27 states have decreasing deaths, 15 states are plateauing, and 9 states are increasing. The highest increase in deaths is Iowa, closely followed by South Carolina. Today 3,685 souls succumbed to COVID19. In one day. We were predicting 500,000 deaths by mid-February. This may be end of February now. TBD.
Vaccinations...are slowly (but surely) starting to gain speed and exponentially increase. Which is huge. We (the U.S.) are administering 9.71 doses per 100 people. In the last week, an average of 1.34 million doses per day were administered. Alaska leads with 13.4 doses administered per 100 people. This is followed by West Virginia (11 per 100) and New Mexico (10.5 per 100). Idaho, you’re last, with administering 6.0 doses per 100 people. (Texas you’re close to the bottom too, at 7.2 per 100 people).
Variants...are gaining speed.-B.1.1.7 variant: Has popped up in 541 Americans across 33 states (Florida has, by far, the most people followed by CA). -B.1.351 variant: Detected in 3 Americans in 2 states-P.1: Detected in 2 Americans in 1 state
We are, quite literally, in a race: vaccination rate vs. variant transmission rate. Hopefully we win before mid-March hits.
Love, YLE
Case data: COVID tracking project
Vaccination data: https://ourworldindata.org/covid-vaccinations
More vaccination data: https://www.bloomberg.com/graphics/covid-vaccine-tracker-global-distribution/
Variant data: https://www.cdc.gov/coronavirus/2019-ncov/transmission/variant-cases.html