
National Update
Looks like we’ve hit our peak in the U.S.? Unfortunately not yet. We won’t start seeing the “true” holiday impact until mid- January.
You may remember my post (back in April, I think) showing that test and case numbers are dependent on human behavior. In Texas, for example, daily case counts are much lower on days with a thunderstorm or tornado warning because testing sites close due to inclement weather. Case counts are highest on Tuesdays and lowest on Saturday/Sunday/Mondays. Reporting 7- or 14-day averages takes care of these day-to-day fluctuations.
The same is true for the holiday season; it’s basically a really long weekend in terms of case and testing numbers. Facilities and labs have been inconsistently open, reporting is delayed, places are catching up, etc. You can see a dip in the graphs, but this is due to human behavior (rather than true reduced transmission). We won’t see the holiday impact until reporting has stabilized. It’s irresponsible to make conclusions from case, test, and death data right now.
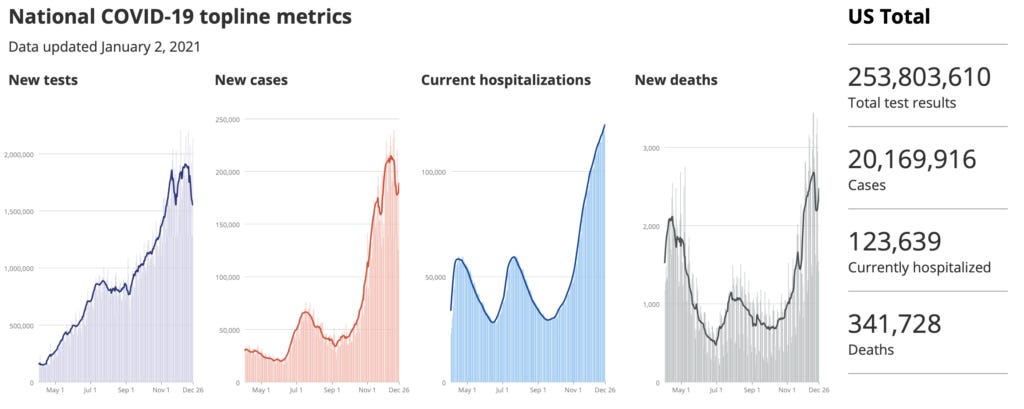
Right now, a much more reliable metric is hospitalizations. Hospitals are open 24/7 and, by now, have rigorous, systematic, and completely separate reporting systems than testing/case data. Because hospitalizations lag cases, we have a pretty good idea of whats been happening with cases behind closed doors.
Unfortunately, hospitalizations are not looking good. Across the U.S., there are 123,614 COVID19 patients hospitalized right now. This is the highest it’s ever been.
Not all places are equal though.
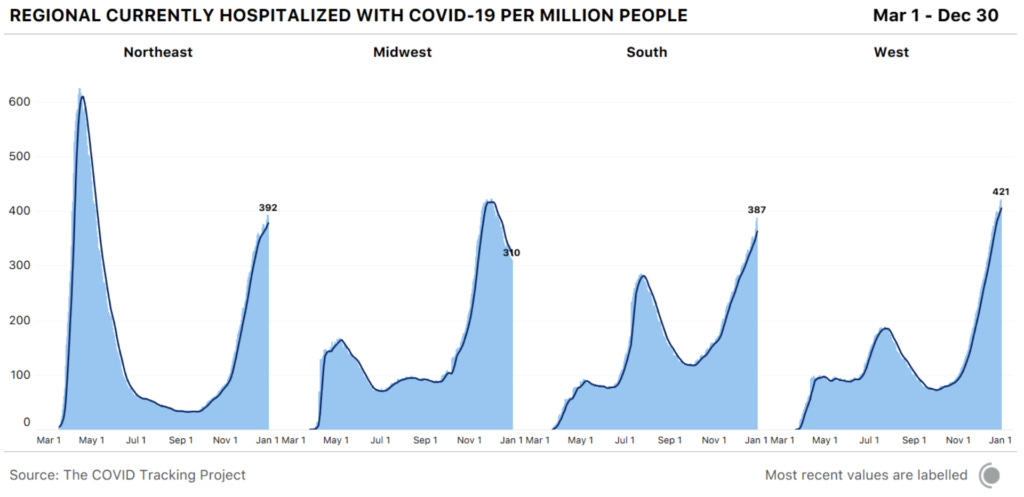
The Midwest continues their downward trend. Not one Midwest state reported an increase in hospitalizations since Christmas.
The South, on the other hand, is responsible for 50% of the country's hospitalizations. This is mainly driven by the high Texas hospitalizations. Also, the South just has more people than the Midwest or Northeast.
After we adjust for population, though, the West and Northeast is in worse shape than the South (but not by much) and closing in on Midwest’s peak. The West’s numbers are mainly due to Southern CA where some hospitals literally (not figuratively) have no more ICU beds.
The way we "define" hospitalizations is also changing compared to the beginning of the pandemic. The threshold for sending someone home is much lower than in the past. For example, some hospitals will send someone home with a 90% O2 level, which wouldn't have happened prior to the pandemic or in the past few months when hospitals had beds. So, in reality, the hospitalization numbers are underestimated compared to hospitalization rates in the past.
Nonetheless, hospitalization is the best metric we have right now. Continue to keep an eye on this number until other metrics stabilize.
Love, YLE
Data Source: Covid Tracking Project, which never ceases to amaze me with their clean, state-level data. And our dashboard at www.texaspandemic.com