
State of Affairs: April 1

The impact of BA.2 in Europe has been consistent with a second case wave in almost every country. Each country’s current location on that wave is very different, though. For example, cases are increasing in France, stalling in the U.K., and falling in Germany, Switzerland, and the Netherlands.
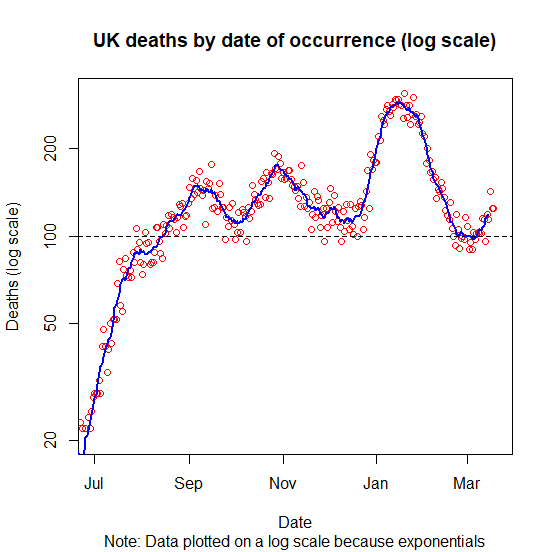
Unfortunately, hospitalizations and deaths continue to lag as well. In fact, U.K. hospital admissions among 65+ year olds have passed their January peak.

The older age groups have the lowest prevalence of infection and the highest rate of vaccination, and data continues to show that about half of hospitalizations are “for COVID.” How could they be breaking hospitalization records? Vaccines could be waning, but recent data has shown this isn’t drastic. This could be attributed to behavior change: with restrictions lifted, older age groups could have recently and substantially changed their behavior after two years. But, more likely, the vulnerable are getting swept up in high community transmission. Vaccines work very well, but they’re not perfect. Even if vaccines were 95% effective against hospitalization, a small percentage change can become a big number when a virus burns through entire populations. We saw this happen in Denmark, too: during their BA.2 case surge, excess deaths were significantly higher for those aged 85+ years regardless of their almost 100% vaccination rate. This is one reason why a “let it rip” approach is so risky.
Because hospitalizations are increasing, deaths are increasing, too. In fact, in the U.K. they are quickly accelerating.
United States
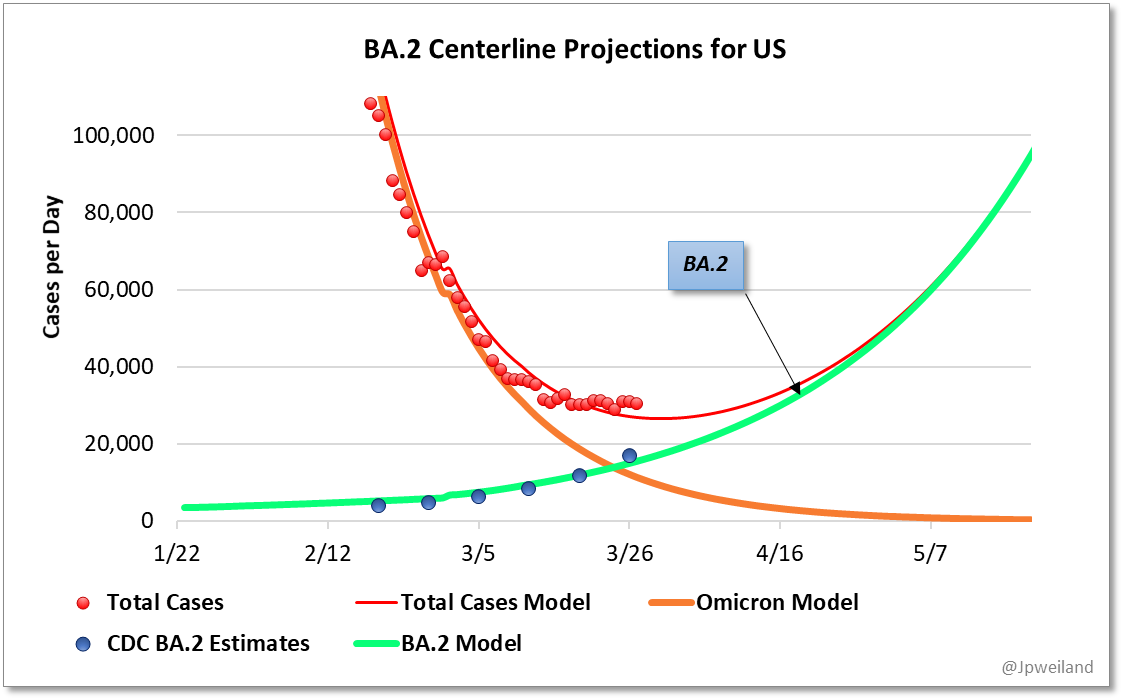
BA.2 is now the dominant variant in the U.S., making up 55% of new cases. This is up 39% from the week before. Prevalence ranges from 37% in the Midwest to 73% in the Northeast. Genome sequencing shows that case growth is right on track with projections. If this trajectory continues, we’ll see about 40,000 new cases per day by mid-April. How big this wave will be is anyone’s guess.
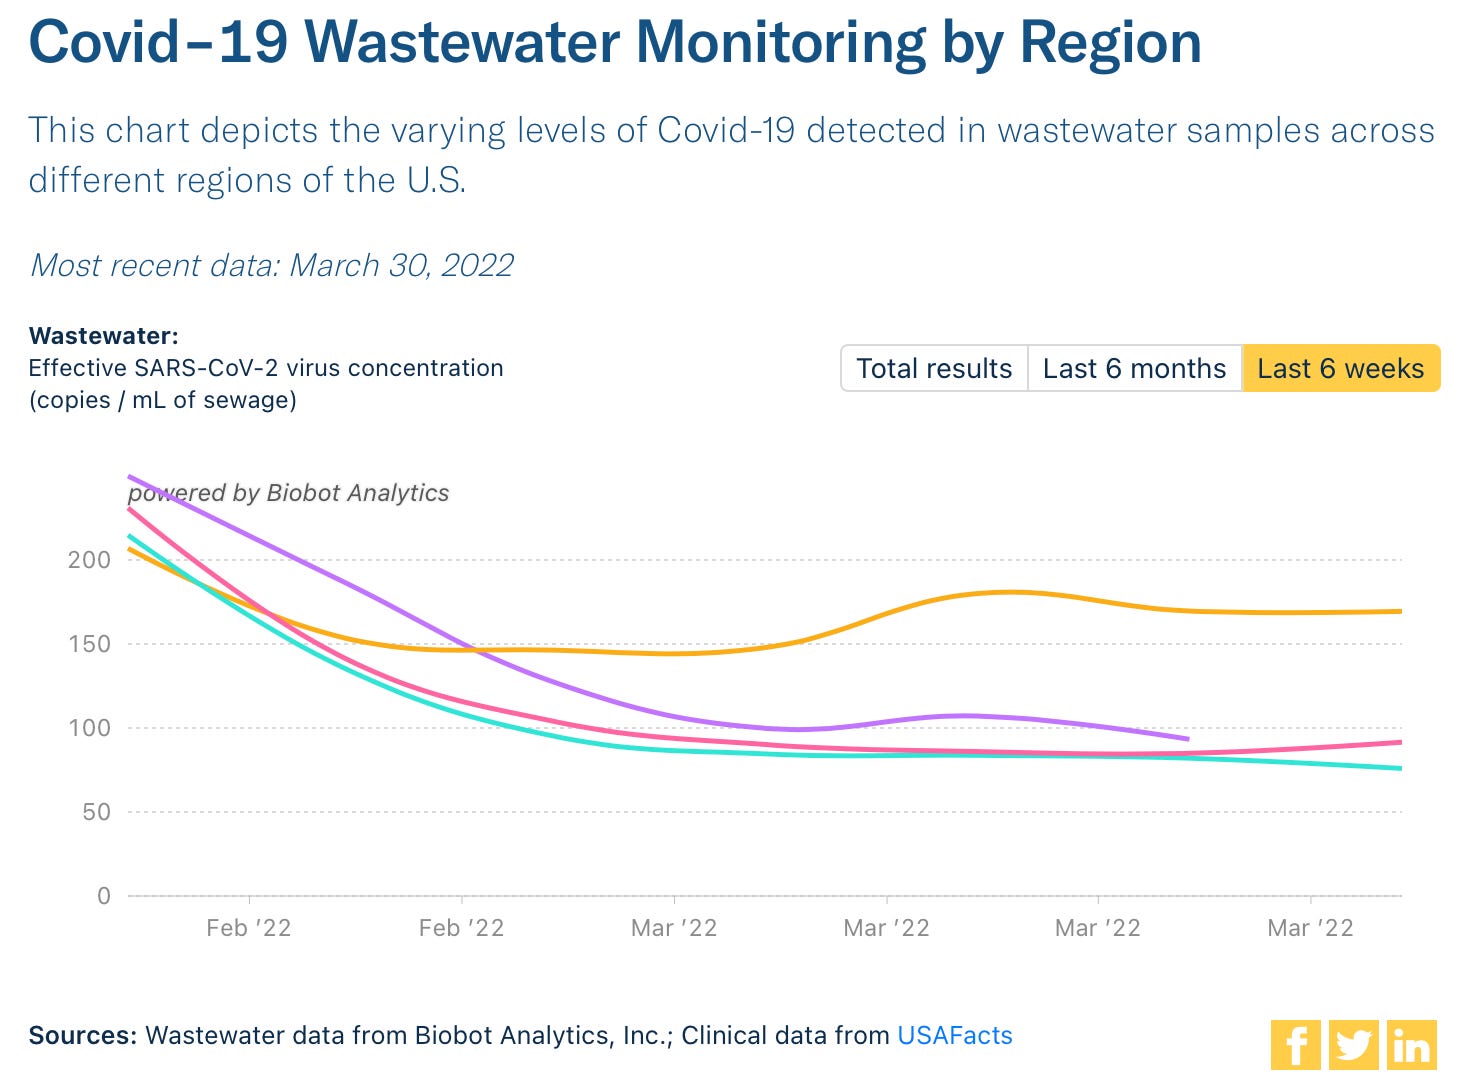
On a national level, some of our early indicators are beginning to feel BA.2’s presence. Test positivity rates (TPR) from PCRs and antigen tests have started increasing. Wastewater as a whole is remaining relatively stable.
Reflective of the early national indicators, national case trends have stalled; they are neither decreasing or increasing. Importantly, they stalled at relatively low daily case rates (27,621 new cases per day). Our lowest record was 14,000 cases per day in summer 2021; our highest was 800,000 cases per day during Omicron. Starting at a low case count will no no doubt help soften the impact of BA.2.
As we’ve seen throughout the pandemic, the story is different on state and local levels. Last week only one state (New York) had increasing case trends. Now, we have 15 states: New York continues to be the acceleration leader, with a 55% increase in cases in the past 14 days.
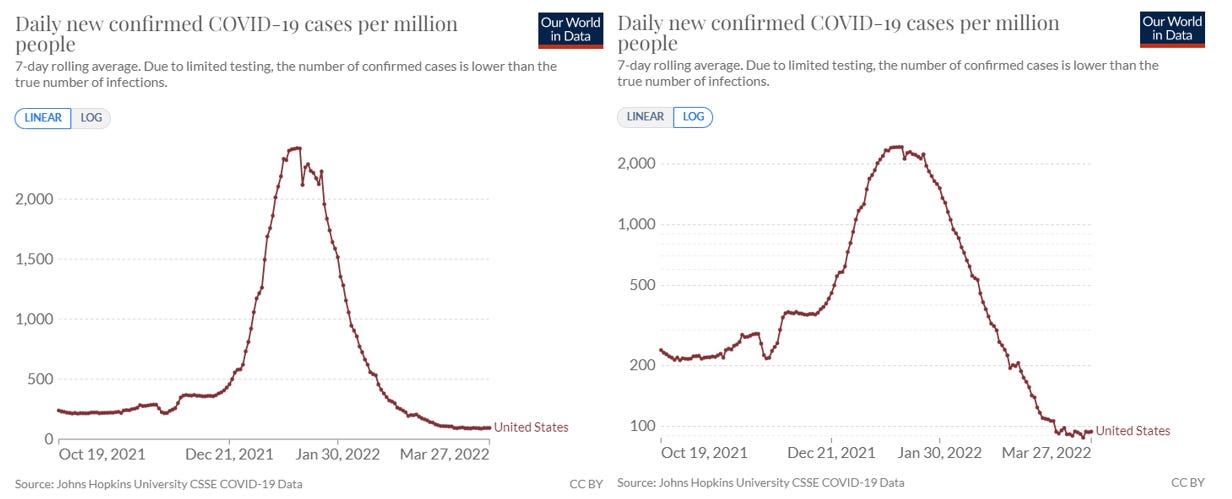
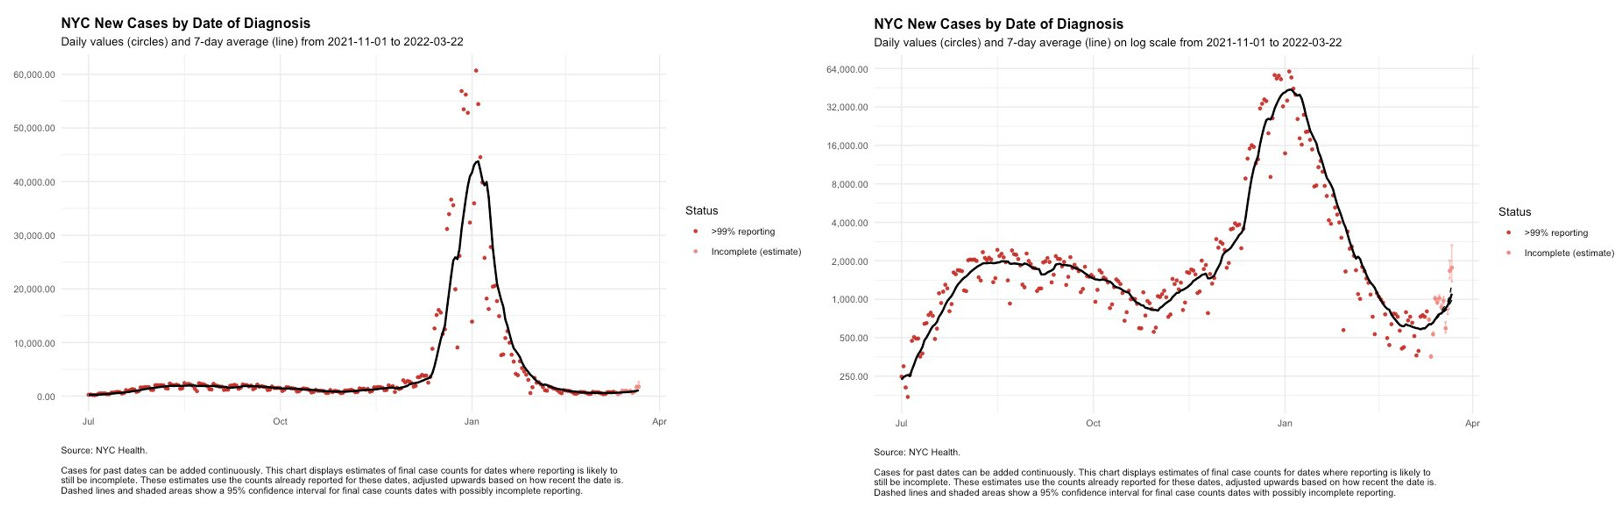
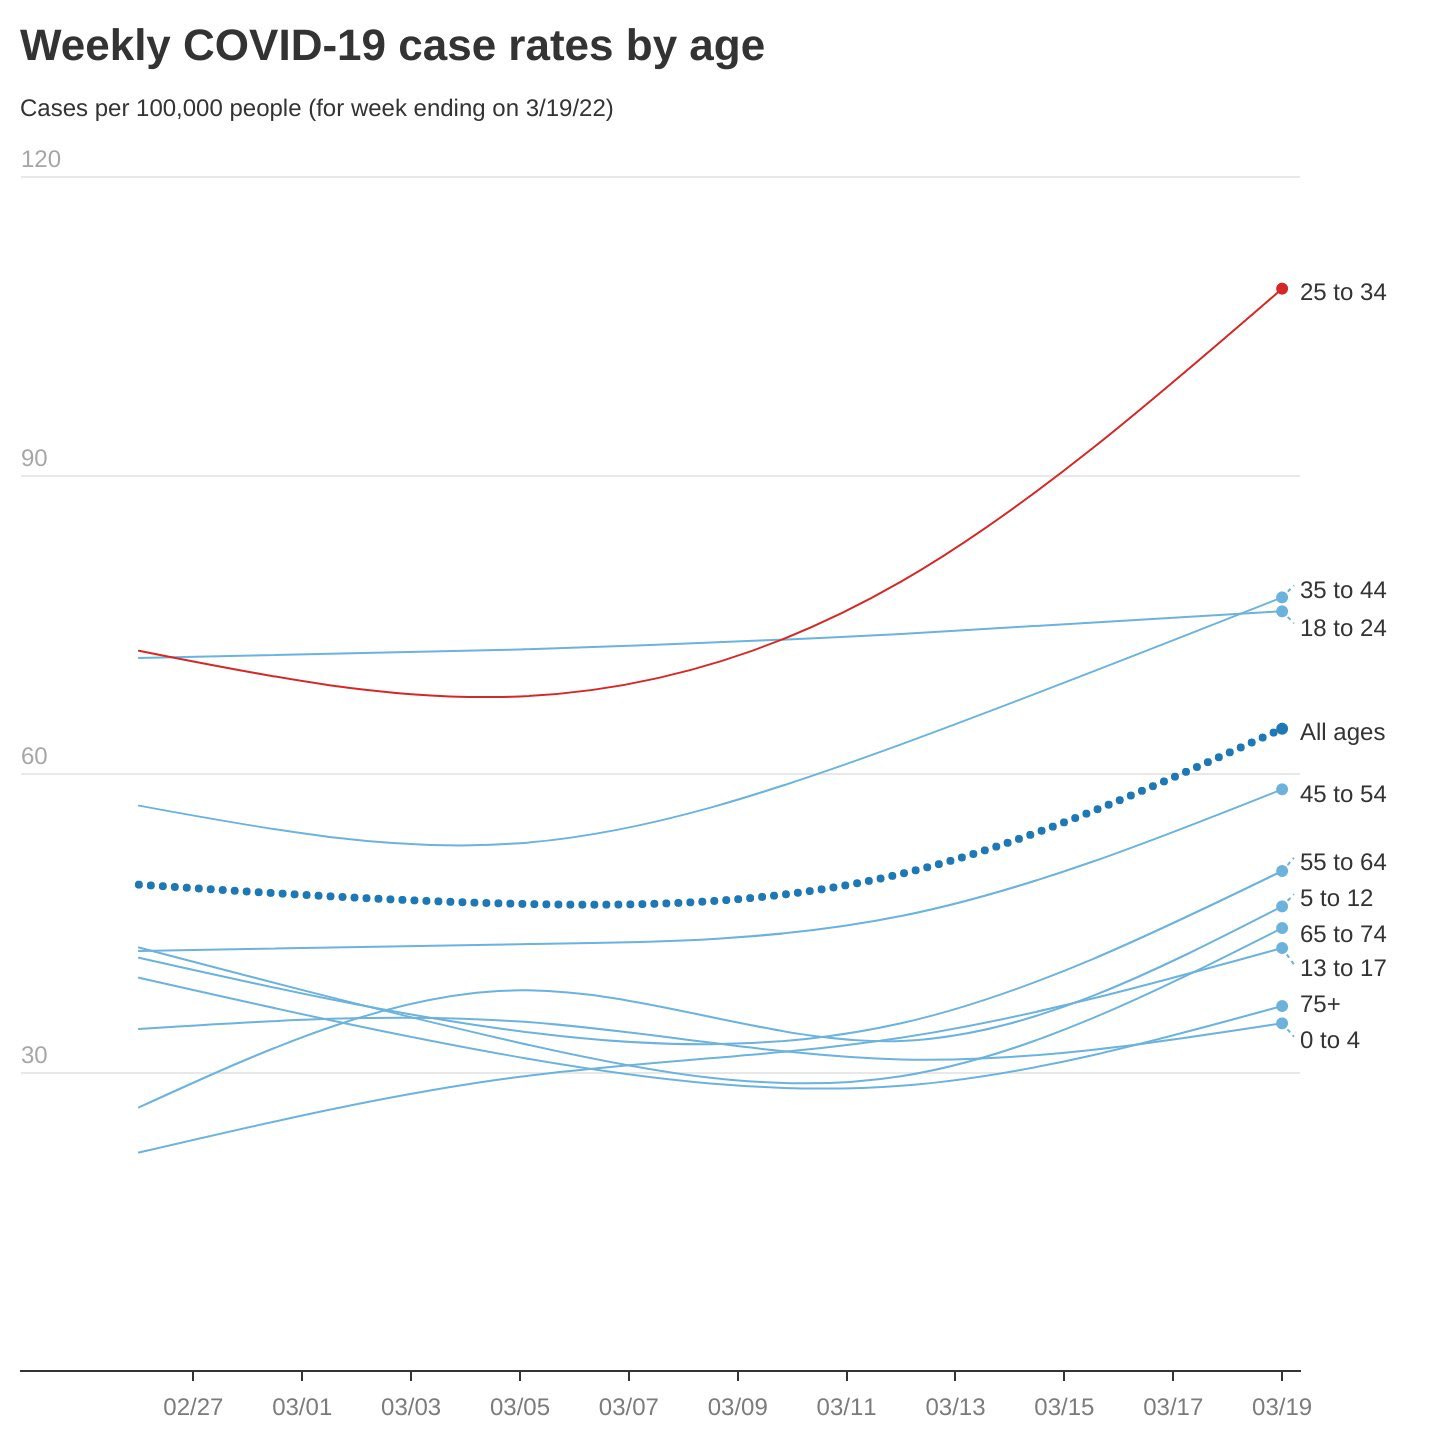
When cases are so low after a massive wave it’s imperative that we look at raw case graphs and log case graphs. To the naked eye, cases can look stagnant but acceleration is happening. New York City, for example, seems to have a flat case rate (left graph below) but cases are increasing very quickly (right graph below). The R(t) in NYC is now around 1.5 and cases are being driven by the younger age groups.
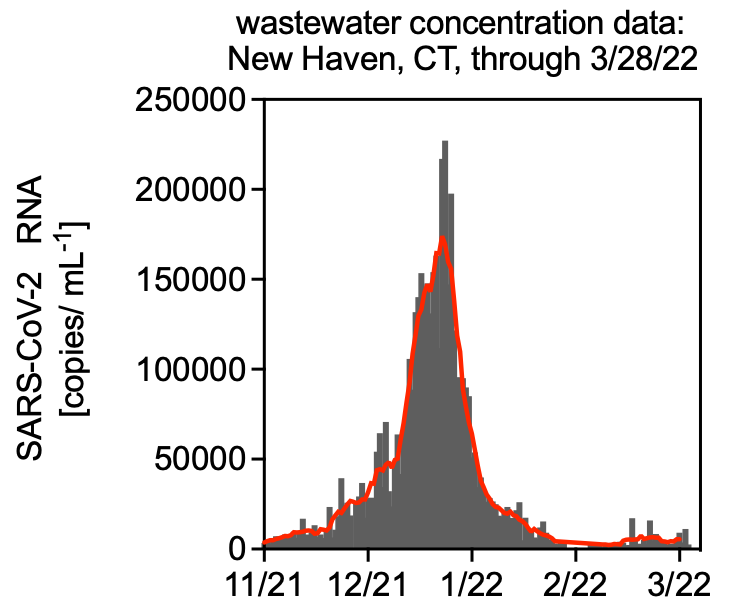
Cases are also increasing in other Northeastern states: Massachusetts (+48%), New Jersey (+37%), DC (+35%), Connecticut (31%), Delaware (+29%), Vermont (+6%), and Maryland (+6%). Mostly minimal changes. Local wastewater trends are trying to figure out what to do, too. In Boston, for example, we are seeing the beginning of exponential growth in the North system. But, the South system has minimal growth so far. Wastewater in New Haven, CT is mostly stable, too. This can change fast, though.

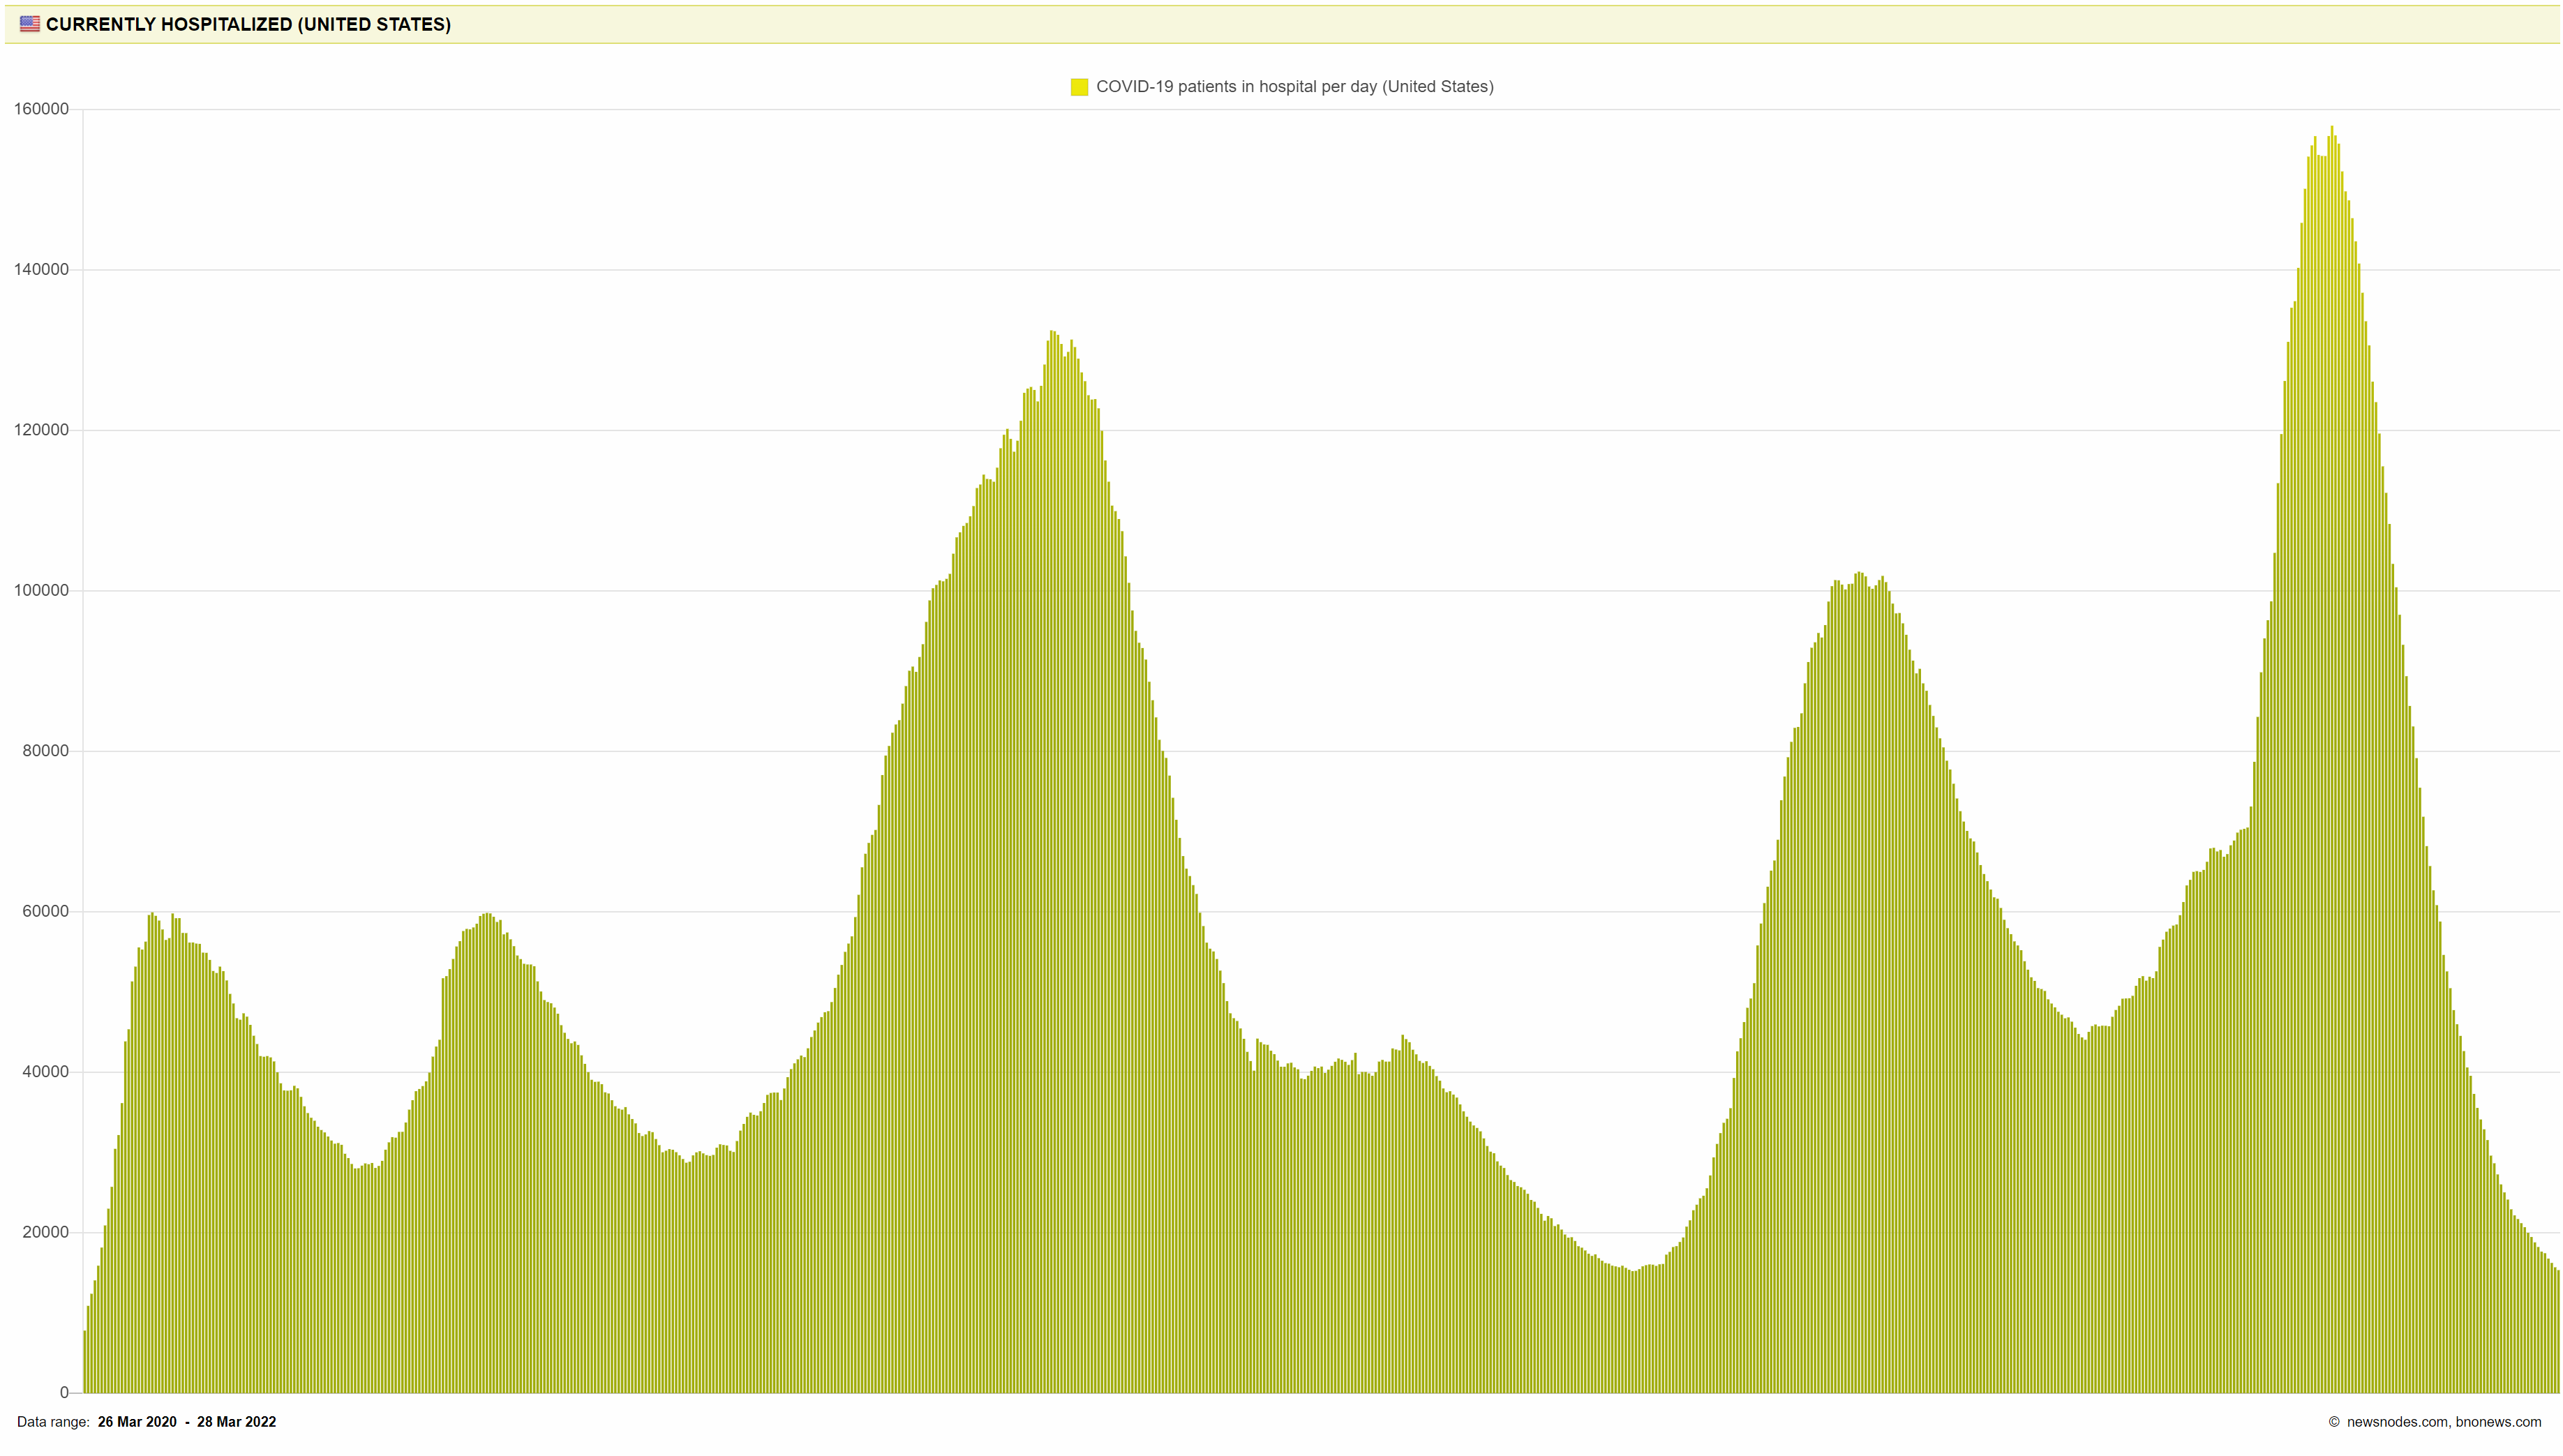
In good news, this Tuesday we reached a huge milestone: the lowest number of hospitalizations since the pandemic began. This is a reason to celebrate, no matter how short this lull may or may not be.
This week we also finally broke the threshold of 1000 deaths per day. Today we are averaging 700 people dying per day. While this is incredibly welcome news, the majority of these are still vaccine-preventable. As Kaiser Family Foundation recently published, COVID-19 was still the second leading cause of death last month.

Bottom line
BA.2’s footprint in the U.S. is starting to show. National indicators are pretty steady right now, but this can change quickly. Will it be a wave? We don’t know. But it doesn’t really matter if you prepare: get boosted, have a plan to get post-infection treatment, like Paxovid, order free antigen tests, and start wearing masks if county cases are increasing.
Love, YLE
“Your Local Epidemiologist (YLE)” is written by Dr. Katelyn Jetelina, MPH PhD—an epidemiologist, biostatistician, professor, researcher, wife, and mom of two little girls. During the day she has a research lab and teaches graduate-level courses, but at night she writes this newsletter. Her main goal is to “translate” the ever-evolving public health science so that people will be well equipped to make evidence-based decisions. This newsletter is free thanks to the generous support of fellow YLE community members. To support the effort, please subscribe here:
How does one plan to get post-infection treatment such as Paxovid?
I wonder if there is a correlation in NYC between new cases and their overall relaxation of pandemic policies. They are no longer checking vaccination cards at the doors of restaurants and entertainment venues. I felt a lot safer in the City last fall and winter than I do now.