Si quiere leer la versión en español, pulse aquí.
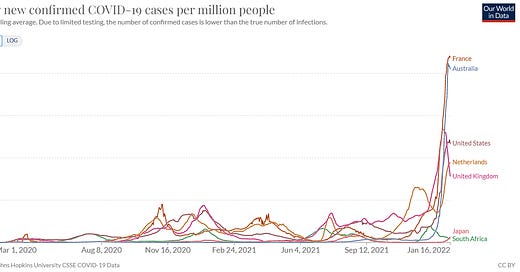
Last week the World Health Organization reported more than 15 million cases of COVID19, which is so high that they had to change the y-axis scale of their epi curve. During the WHO press conference, one advisor said, “In 30 years working on infectious diseases we have not seen an epidemic curve like this before.”
While many countries are on their way up the curve, the Omicron leader—South Africa—continues to decline. Interestingly, South Africa is taking its time with the descent. While it took 3 weeks to peak, it’s been almost 5 weeks in the descent and hasn’t reached pre-Omicron levels yet. South African deaths are still increasing and are now 23% of that of the Delta wave. Not even their Omicron wave is over yet.
There are a few countries in particular that I’m paying close attention to right now:
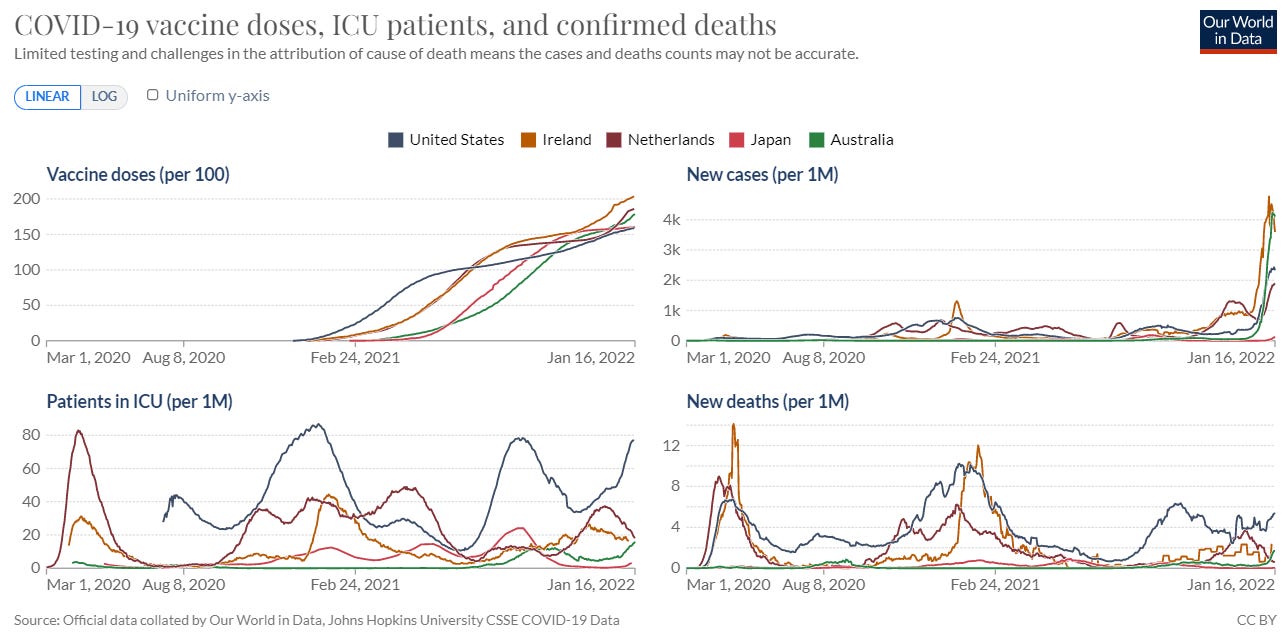
Netherlands: This was the first European country to return to a full lockdown with the arrival of Omicron. And it seems to be paying off: While their cases are increasing, their hospitalizations and ICU trends are exponentially decreasing. They have great vaccination coverage (71%), but it certainly isn’t high enough to drive this pattern alone. A few days ago they lifted the lockdown, so I will be closely watching their indicators.
Japan: Vaccine+ plan (80% fully vaccinated plus masks, contact tracing, communication, and quarantining) continues to work. Cases have begun to uptick, so it will be interesting to see if their model holds up with Omicron as it has throughout the pandemic.
Australia: They continue to be interesting to follow, as they’ve had tight lockdowns throughout the pandemic. While they have high vaccination coverage (78%), it’s not doing enough for Omicron. Australia has a ridiculous number of cases right now—almost double that of the United States—and severe disease indicators are trending upwards.
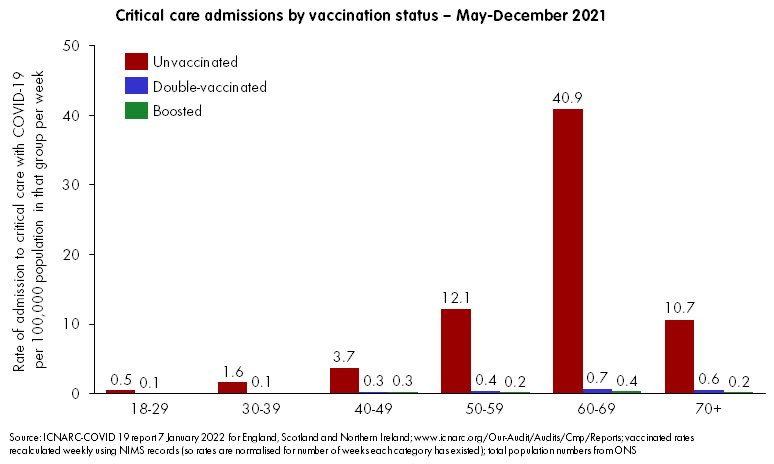
But, no matter where Omicron goes, it’s clear that these severe cases are largely among the unvaccinated. For example, the Intensive Care National Audit & Research Centre in the U.K. updated their analysis of COVID-19 patients in the ICU in England, Wales, and Northern Ireland. The figure below says a thousand words. (For those of you looking for absolute risks, go here. For example, the 5-year risk of ICU among boosted is less than 0.01% across all age groups now).
Our World in Data reports the death rate of 15 countries by vaccine status. It doesn’t take too long on this page to see how well vaccines are working, even during the Omicron wave. For example, Switzerland now reports deaths by booster status and the story is also clear.
United States
The United States is averaging a staggering 801,903 cases per day with a 98% increase in the past two weeks. Our cases have plateaued, which could be an indication of one of three things:
We reached testing capacity. I would not be surprised if this happened, but I don’t think this is the case because test positivity rate (TPR) has also shown indications of peaking at 29%.
Holiday effect: A weekend effect and, specifically, a holiday effect. We should know if this is the case pretty soon as data will be dumped later today; or,
Peak: We truly peaked on a national level. This would be sooner than we expected (projections were estimating Feb 3), but obviously a welcome sign.
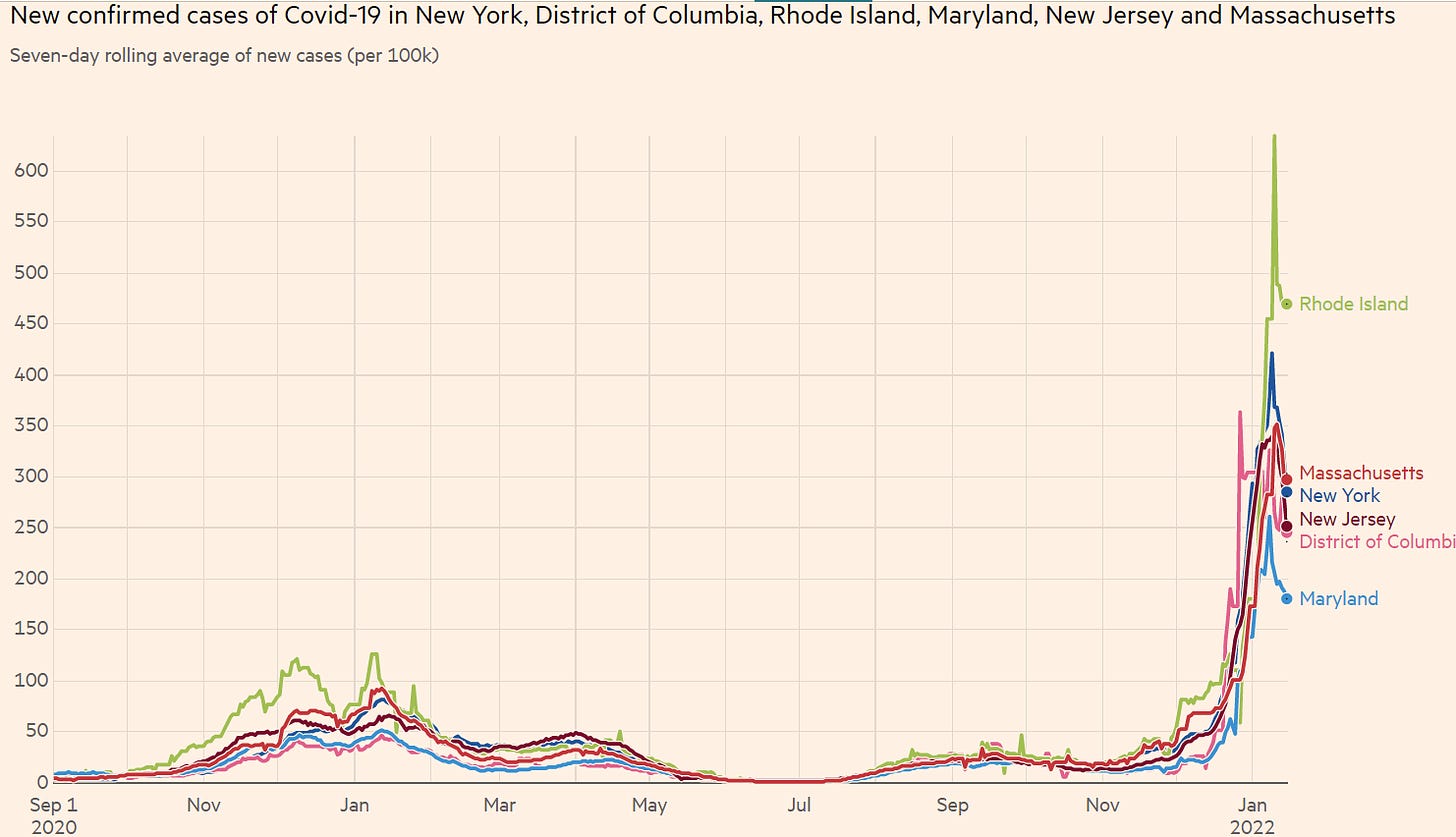
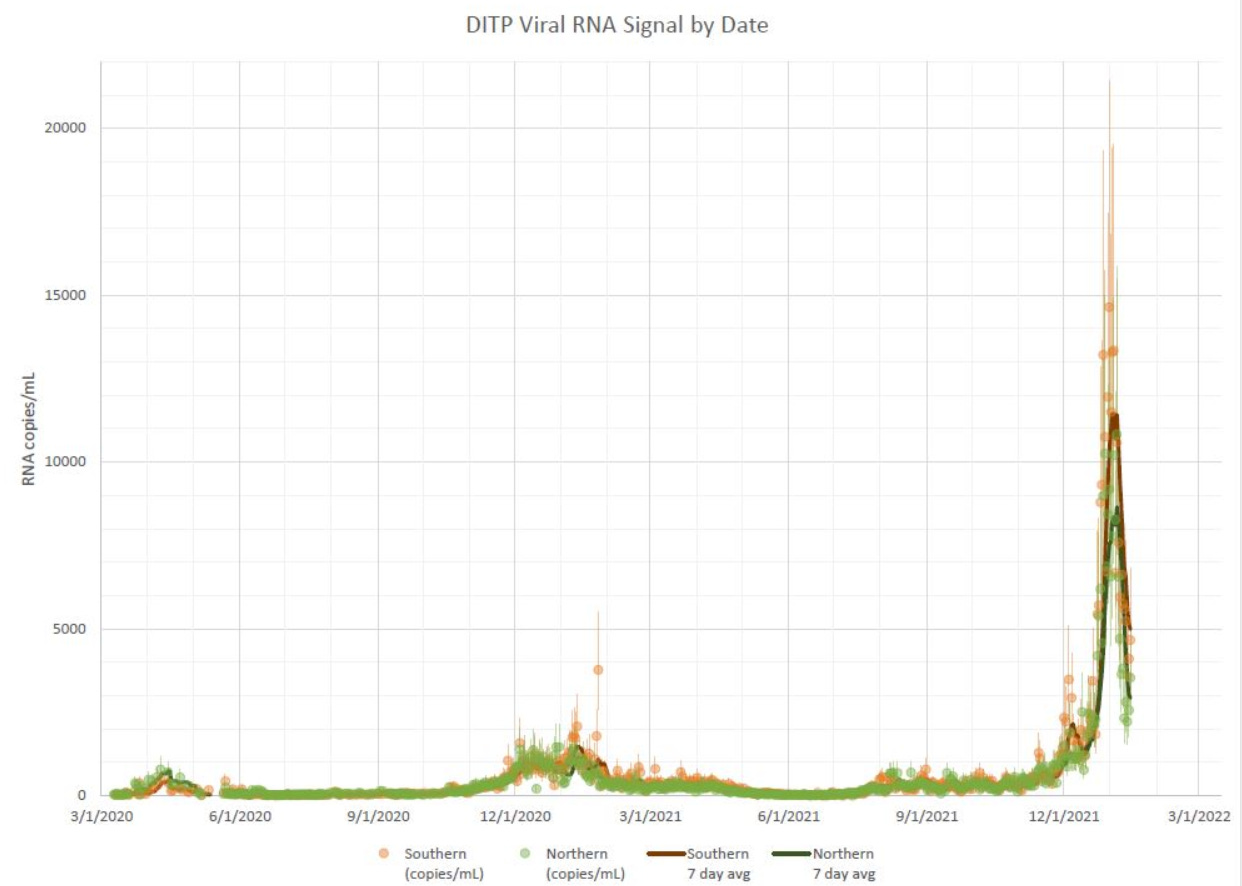
On a state-level, cases in many Northeast states, like New York, Massachusetts, New Jersey, and Maryland, have clearly peaked and started nosediving. We are not only seeing this in case and TPR patterns, but we’re seeing a similar pattern in wastewater. In Boston, viral loads in fecal samples continue to decline and have almost reached pre-Omicron levels. An extraordinary turnaround.
States in the West are now growth leaders, with cases in Alaska (+610%), Texas (+428%), Utah (+414%), Oregon (+402%), and Montana (+394%) exponentially increasing in the past 2 weeks. While some of these cases are among the vaccinated, cases are still dominated by unvaccinated people. CDC hasn’t updated their website since November 20 (get it together, CDC!), but many jurisdictions regularly report cases by vaccination status. For example, below is the latest graph from the Oregon Health Authority. I don’t know if this differentiation could be partially driven by testing behaviors, like unvaccinated people being more likely to get a PCR test than vaccinated.
Hospitalizations
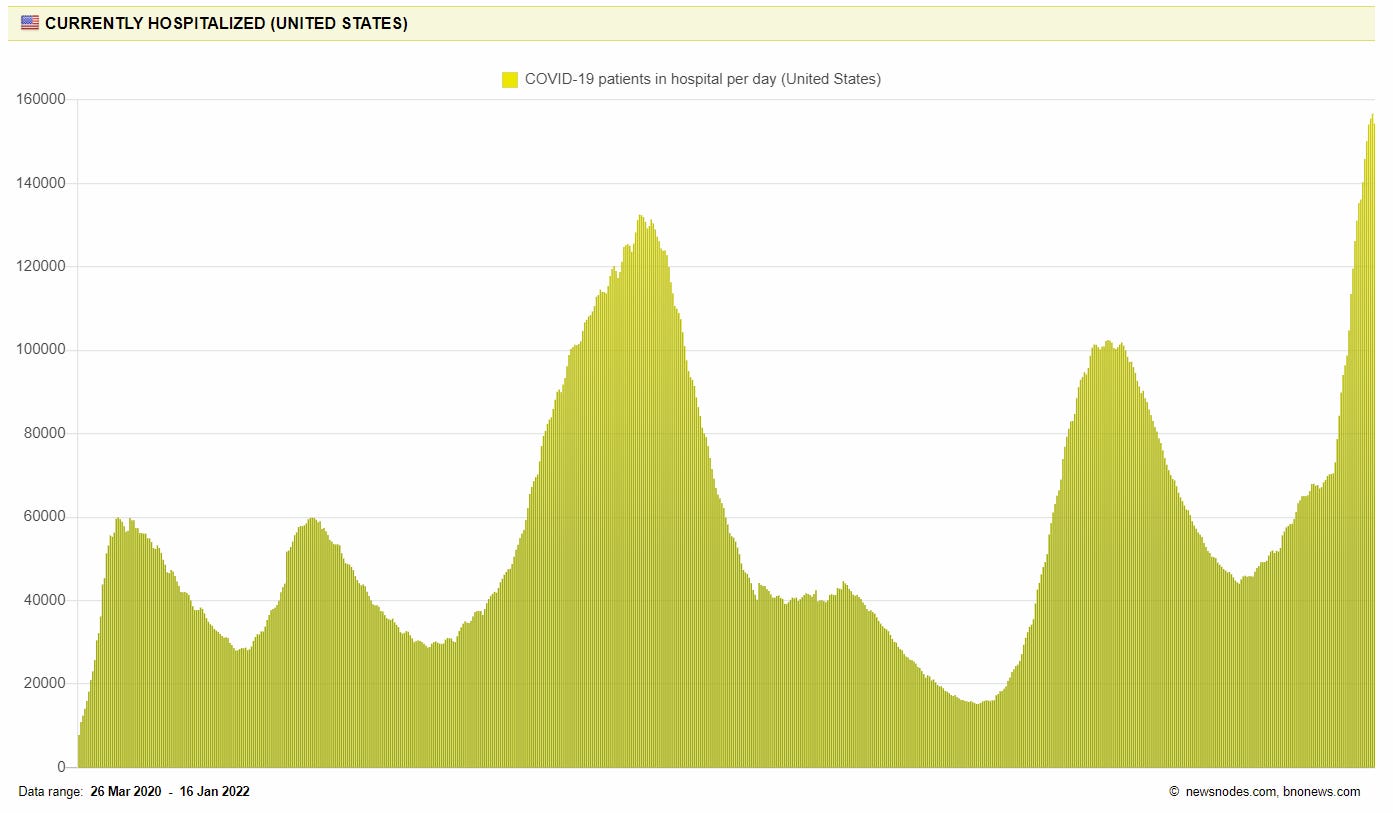
On average, 155,943 people are hospitalized for/with COVID19 in the United States, which has increased 61% over the past 2 weeks. We have long passed last winter’s peak (and the previous record) by 20,000 hospitalizations and counting.
In fact, 31 states are reporting hospitalization rates higher than previous winter. Washington, D.C. is just hammered with hospitalizations at 308% of last winter’s hospitalizations, equating to 128 per 100,000 residents being hospitalized for COVID19. This is followed by Delaware (70 per 100K), New Jersey (70 per 100,000), New York (68 per 100K), and Pennsylvania (63 per 100K). Thankfully, though, it looks like hospitalizations in these states are slowing down and will be on the descent soon.
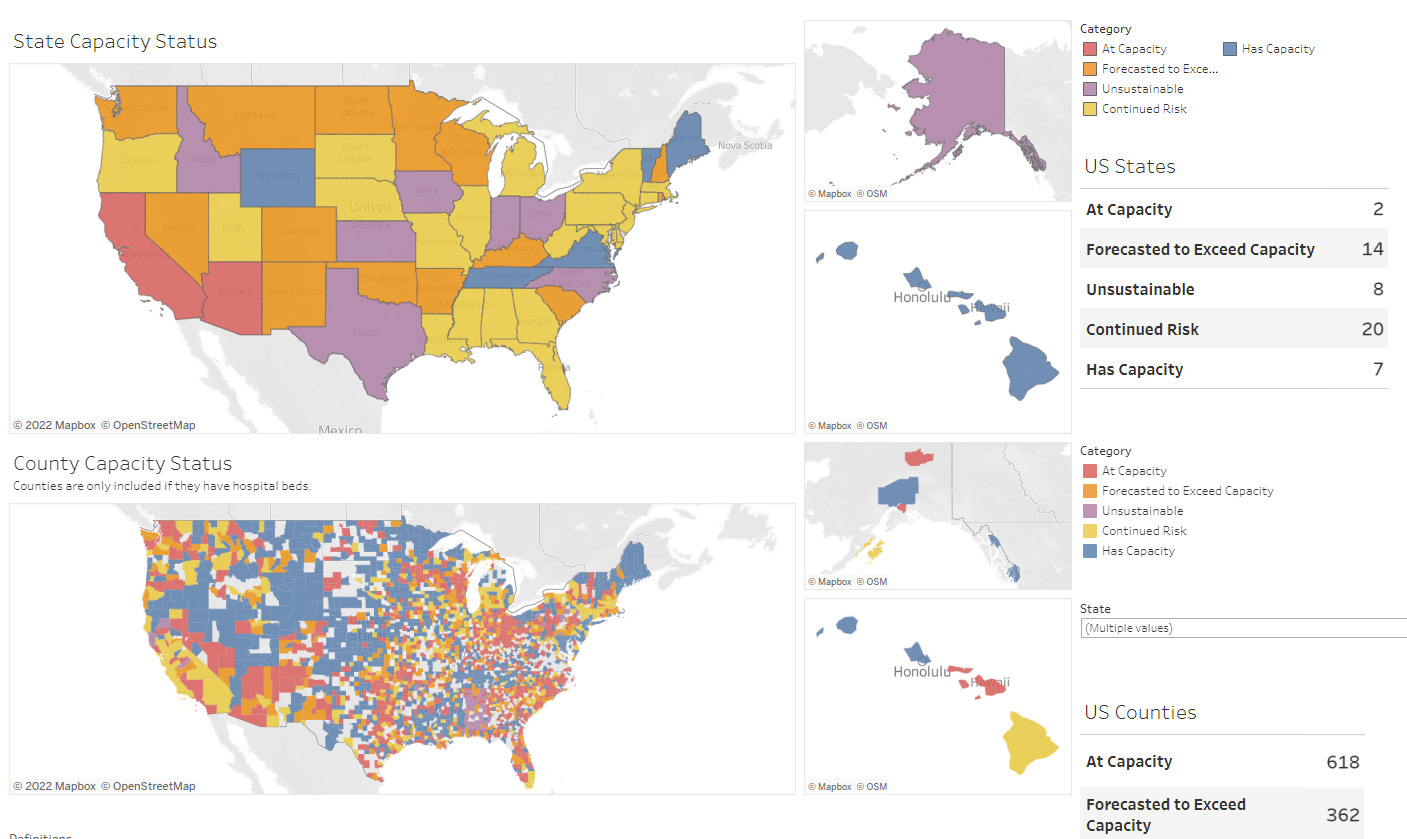
There are two states and 618 counties that require circuit breakers (i.e. short-term mitigation measures needed to preserve hospital functioning) at this point because their hospitals are at or above 100% capacity (assuming that the number of staffed beds has not increased in the past week). Medical military personnel have already been dispatched to a number of hospitals across the nation. Nebraska also joined a short list of states that have enacted its Crisis Standards of Care plan. But community-wide efforts to reduce spread desperately need to be taken, too. Fourteen additional states are at high risk of exceeding 100% hospital capacity in the next 1-10 days.
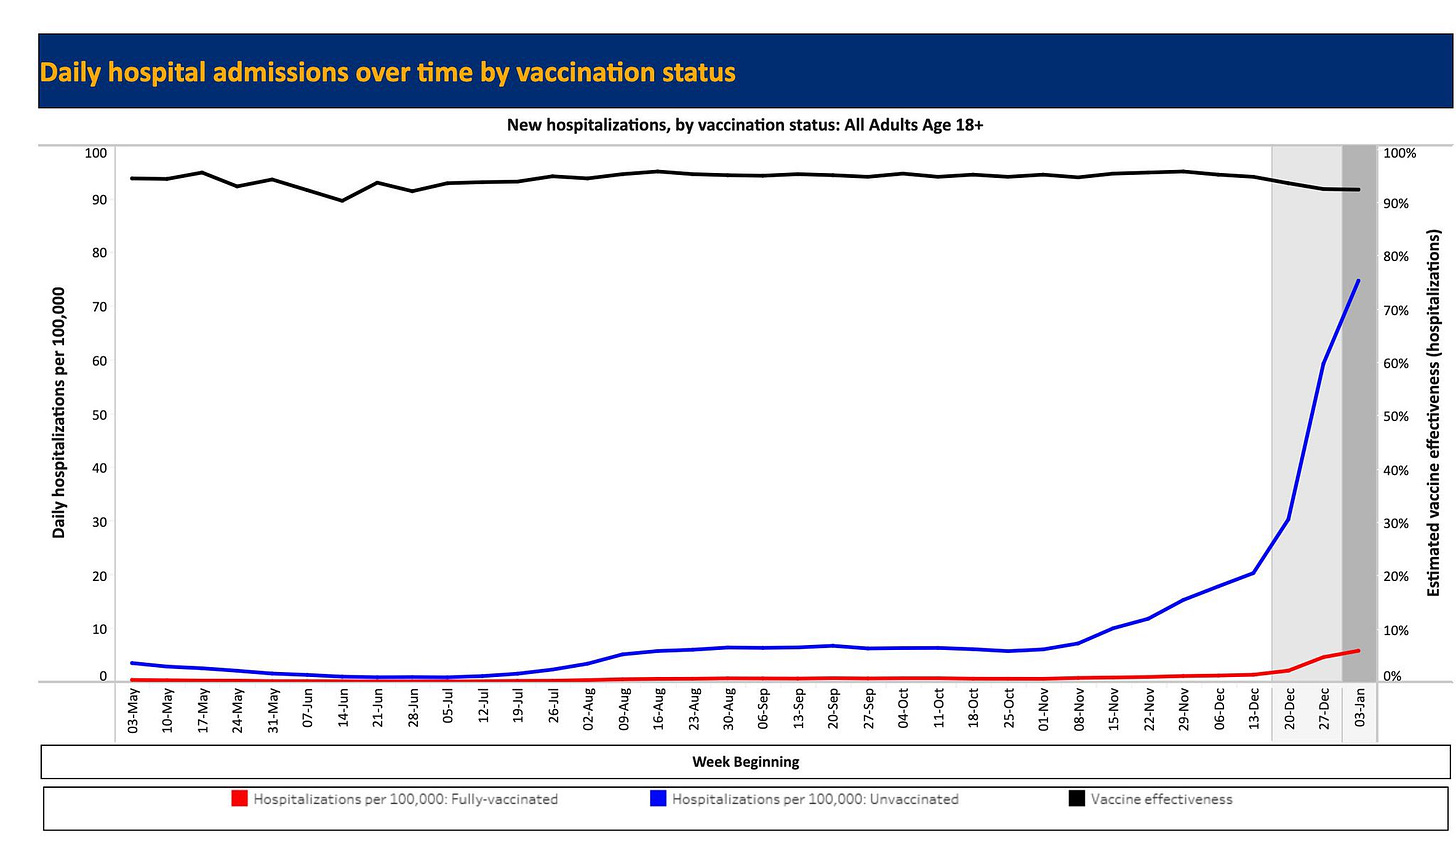
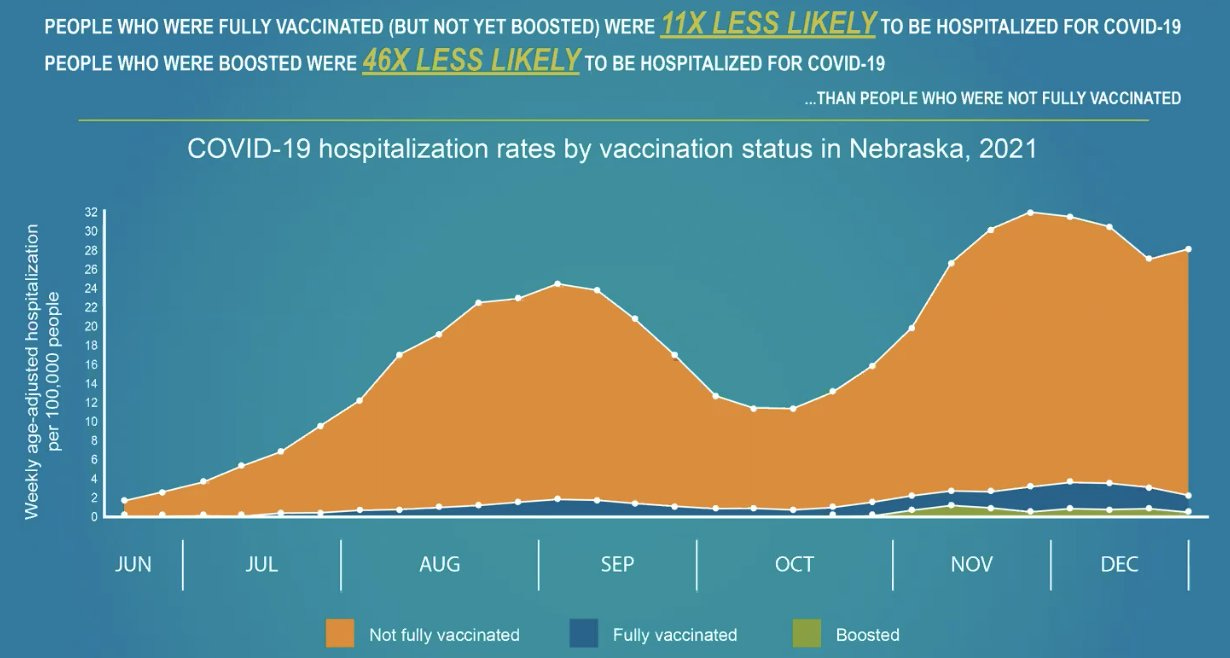
And, just like other countries, vaccines continue to work. For example, the graphs of daily hospitalizations in New York State and Nebraska are worth a thousand words. Hospitalizations and deaths among the vaccinated aren’t even a blip on Oregon’s graph, too.
Deaths
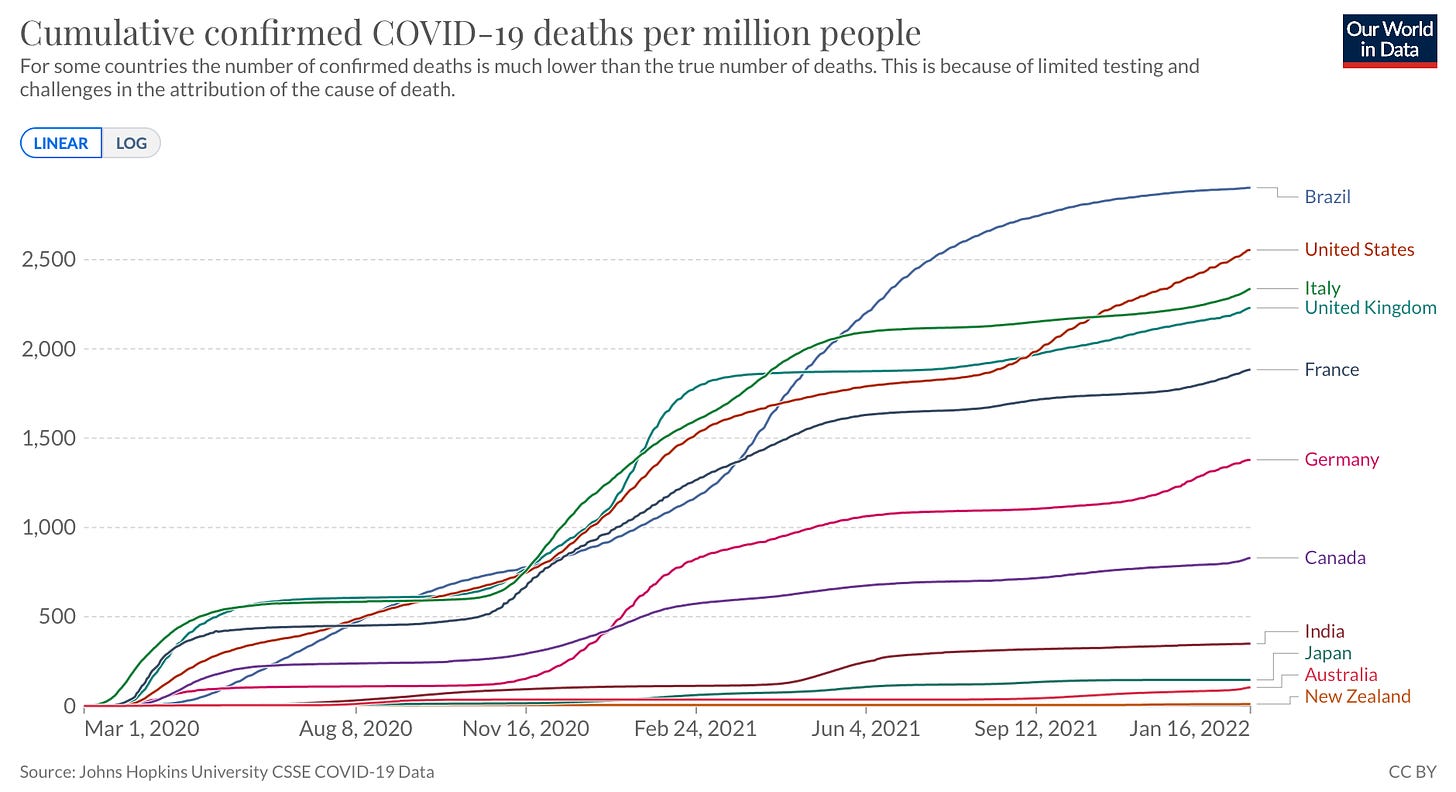
And, finally, we are averaging a sobering 1,964 deaths per day in the United States. Yesterday we hit 850,000 deaths in the United States. For the record, this is one of the highest death rates per capita in the world. And the majority of the last 250,000 deaths were vaccine preventable. As Peter Hotez said, “Death by anti-science.” And a true national tragedy.
Bottom line: The United States has reached (or is close to reaching) its case peak, which is a very welcome reprieve. But this only means we are halfway through the Omicron wave—there will be the same number of new infections on the way down as there were on the way up. Hospitalizations and deaths will follow. Nonetheless, vaccines continue to work really well. But it’s clear that a vaccine-only approach isn’t going to get the United States out of this pandemic.
Love, YLE







From an epidemiological standpoint, this information is fascinating. From a nursing standpoint, it is moderately terrifying. Here, in Virginia, our new governor has removed mask mandates for K-12 public schools, flaunting CDC recommendations, and opposes vaccine mandates for healthcare workers. I'd be interested in policy change impacts on our state but am not confident in his newly appointed cabinet members overseeing VHHS and VDH to adequately report. Time will tell.
The best summary in a while. If one reads this and still doesn't get it, he is reading in the wrong language!!