
State of Affairs: Jan 24

Si quiere leer la versión en español, pulse aquí.
Well, we are officially still in a pandemic. On January 19, the WHO Emergency Committee unanimously agreed that COVID19 is still a “public health threat of international concern.” Here is their specific statement:

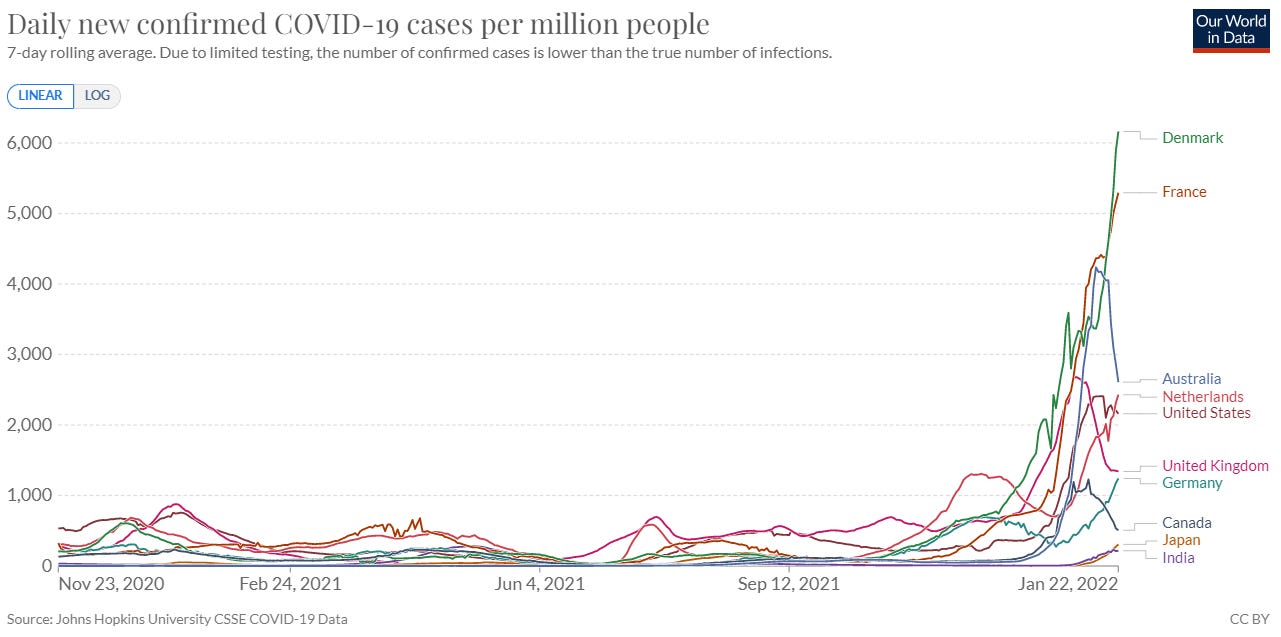
And at this point, there is a mix of case patterns around the globe, with some countries in case growth (like the Netherlands, France, and Denmark), some in a plateau (like United States), and others nosediving (like Australia and Canada).
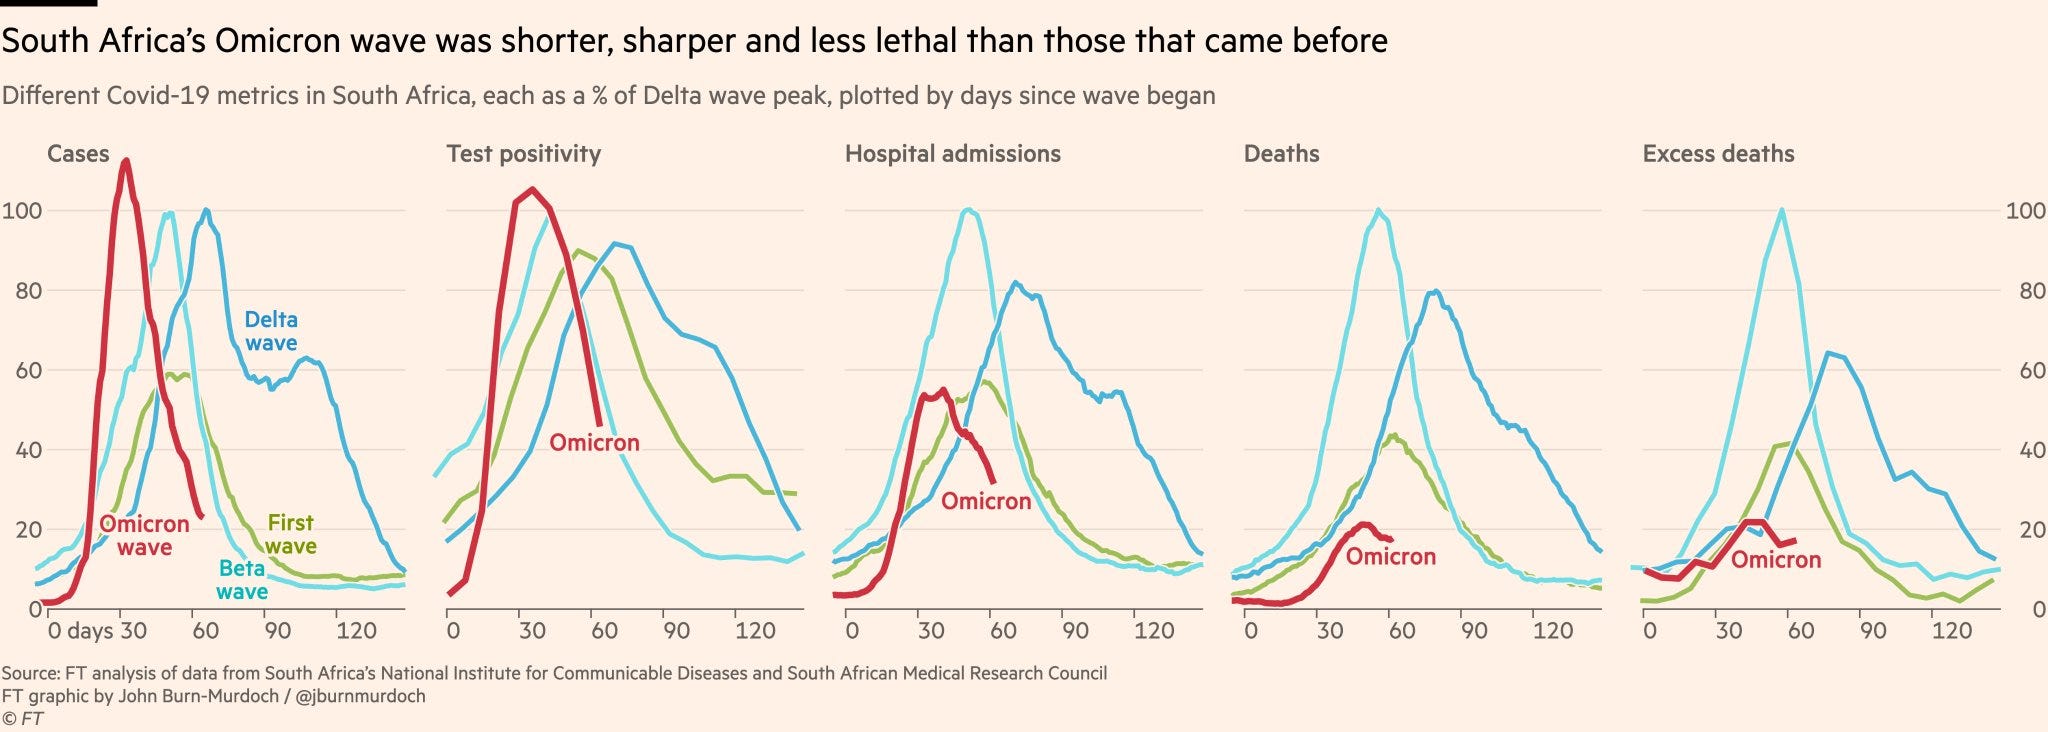
Over the weekend, we reached an important milestone in South Africa—Omicron’s epicenter—as all indicators peaked. We were waiting for deaths to peak, which happened at 20% of Delta’s peak. Today, their test positivity rate is below 10%, indicating that transmission is largely under control for now.
BA.2
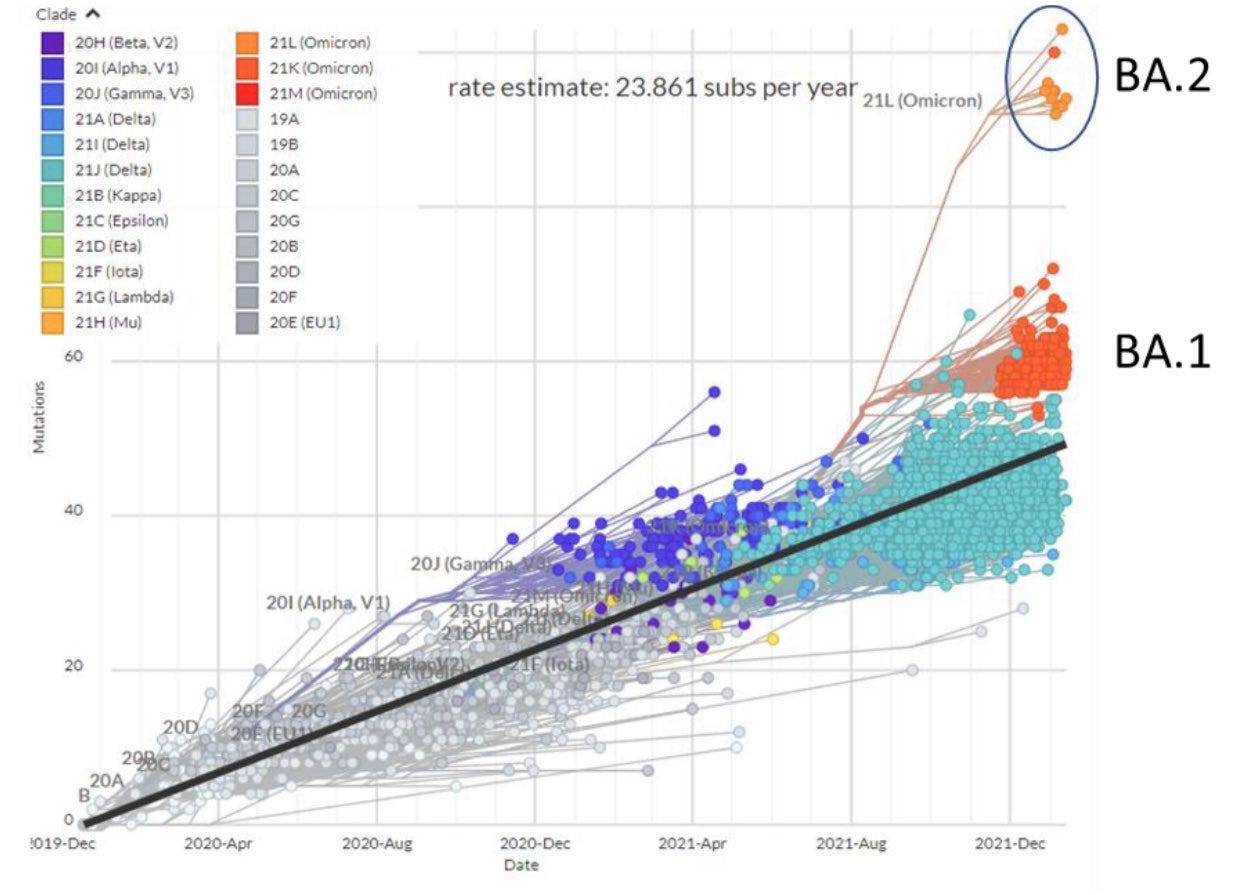
But case patterns across the globe may change soon. That’s because a new sub-variant is taking hold: BA.2. Late last year, Omicron (called BA.1) mutated into a sister lineage. This new version of Omicron has many of the same mutations as BA.1 but has a lot of differences, too. The figure below shows the number of mutations (y-axis) across time (x-axis): BA.2 has ~85 mutations while BA.1 has ~60 mutations. Usually it takes a while for this many mutations to arise, but it didn’t this time. Could this be due to animal reservoirs? In other words, is this mutation a result of the virus jumping from humans to animals and back to humans? Maybe, we don’t know.
Importantly, BA.2 lacks the spike mutations Δ69-70. This is important, because it means, unlike with BA.1, BA.2 doesn’t have a special signal on PCR tests to tell labs that it is Omicron. All tests now need to go to genetic sequencing for variant identification. This is why the Guardian coined it the “stealth” version of Omicron a month ago.
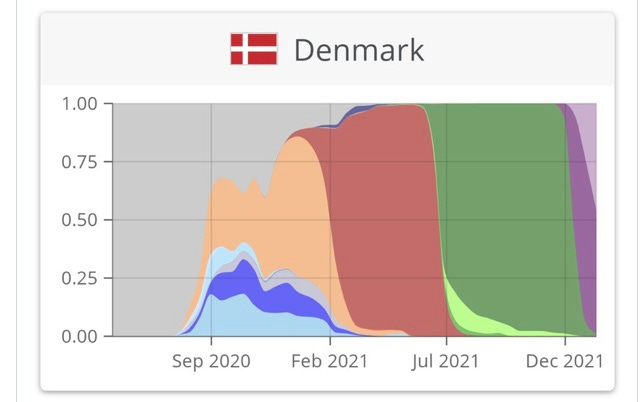
On Friday, the U.K. labeled BA.2 a “Variant Under Investigation (VUI),” as it’s doubling every 4 days there which equates to a 120% growth advantage over BA.1. VUI is the least severe variant classification, but still a signal that we need to pay attention. BA.2 has already started to take hold in places like India, Philippines, Netherlands, France, and Denmark. Below is a graph of variants over time in Denmark. Dark purple is BA.1 (the original Omicron). Light purple is BA.2, and its presence is taking over pretty quickly.
There’s a lot we don’t know about this variant, but we have a few clues so far:
Transmissibility: The consistency of BA.2 growth across several counties means that it’s more transmissible than BA.1. It’s likely nothing like the huge transmissibility jump we saw from Delta to Omicron, though (500% growth advantage). This means that Omicron waves will likely be drawn out (like we are seeing in Denmark or France). In places like the United States, we may see two peaks for the same wave. This won’t be a massive wave on top of another massive wave, though. It’s still Omicron.
Severity: Early data from Denmark shows there’s no disease severity difference between BA.1 and BA.2.
Immunity: There is likely to be minimal differences in vaccine effectiveness in BA.2 compared to BA.1. In other words, our boosters will still work very well. It is also very likely that there will be cross-reactivity: BA.1 infection will protect against BA.2 infection.
We know this virus will mutate. And BA.2 is an example that it’s doing what we expect. We should keep an eye on this, but I’m not too concerned right now. I’m more concerned about another variant popping out of nowhere like Omicron did.
United States
Cases in the United States have largely plateaued at 690,448 cases per day (208 cases per 100,000), with a modest 2% increase over the past 2 weeks. The Northeast has clearly peaked, with cases plummeting in New Jersey (–64% 14-day case change), Washington DC (–61%), New York (–58%), and Maryland (–54%). This is offset by growth in Oklahoma (+196%), Idaho (+174%), Alaska (+164%), and Wyoming (+141%).
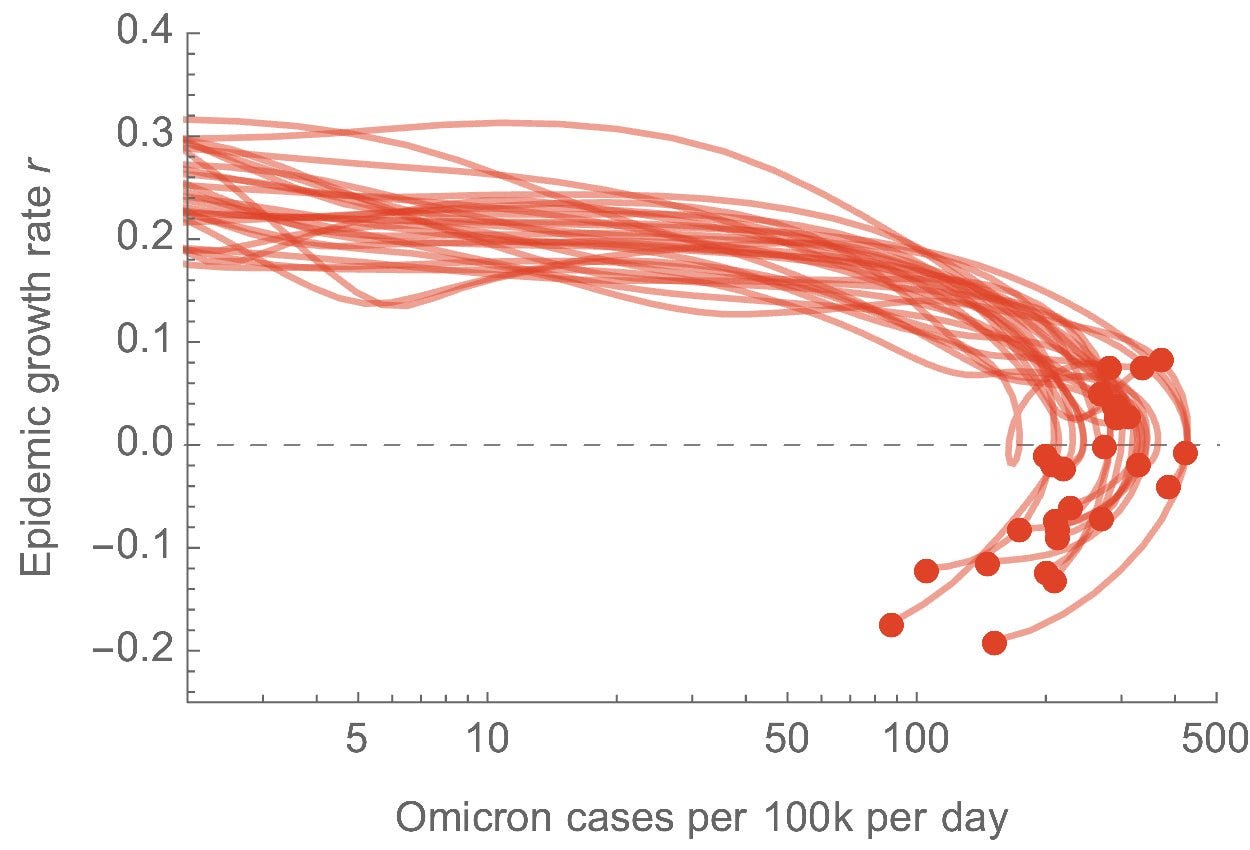
As Dr. Trevor Bedford, a brilliant computational epidemiologist and scientist, pointed out, these epidemics across states have proceeded in a strikingly similar fashion and most states seem to be on the same curve. Some are just farther a head on this curve than others (see figure below). Dr. Bedford estimated that as of January 17, 4.5% of the U.S. population recorded a confirmed case. After accounting for under-reporting, we should expect 36-46% of the U.S. population to have been infected by Omicron by mid-February. This is just astounding for a virus to achieve in a short 8 weeks.
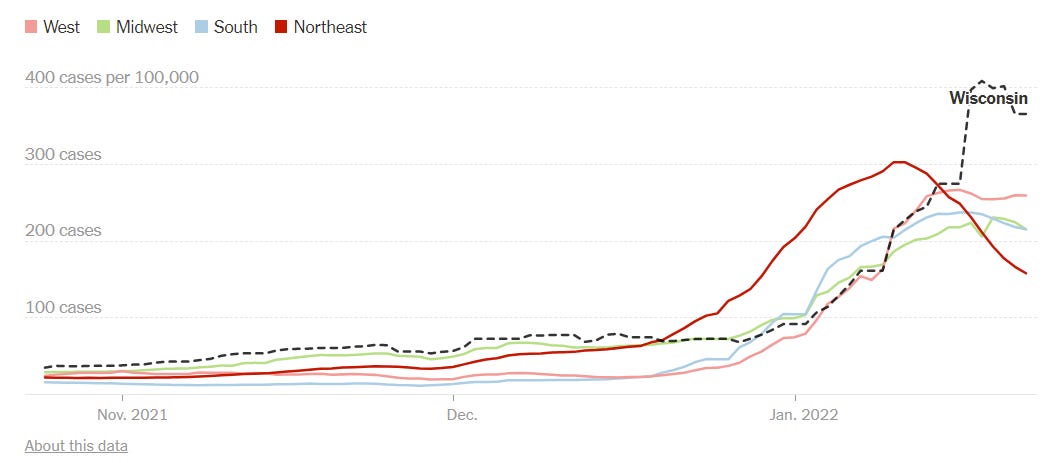
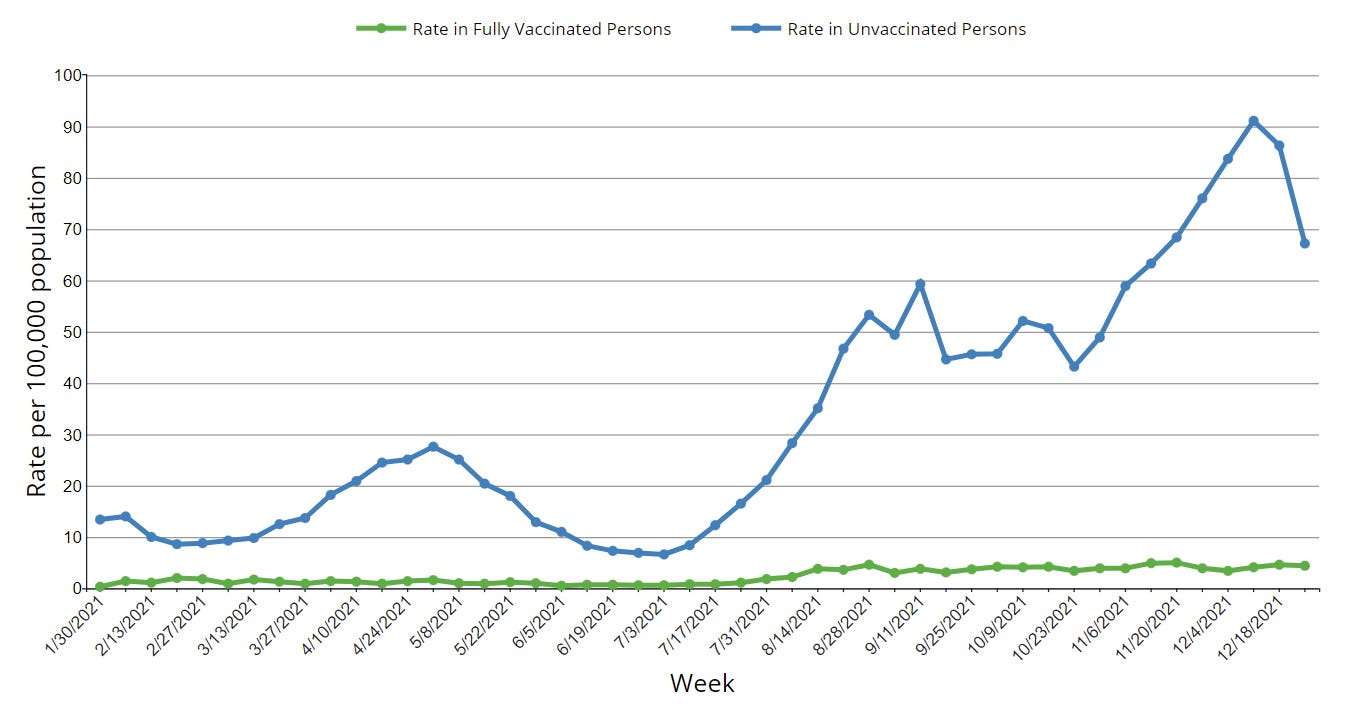
Hospitalizations in the United States have increased 24% over the past two weeks, and we currently have 158,825 people hospitalized. There are preliminary indications that hospitalizations have begun to plateau, though. And hospitalizations continue to be largely among unvaccinated people. In fact, this weekend in New York City hospitalizations among unvaccinated people were literally off the chart.
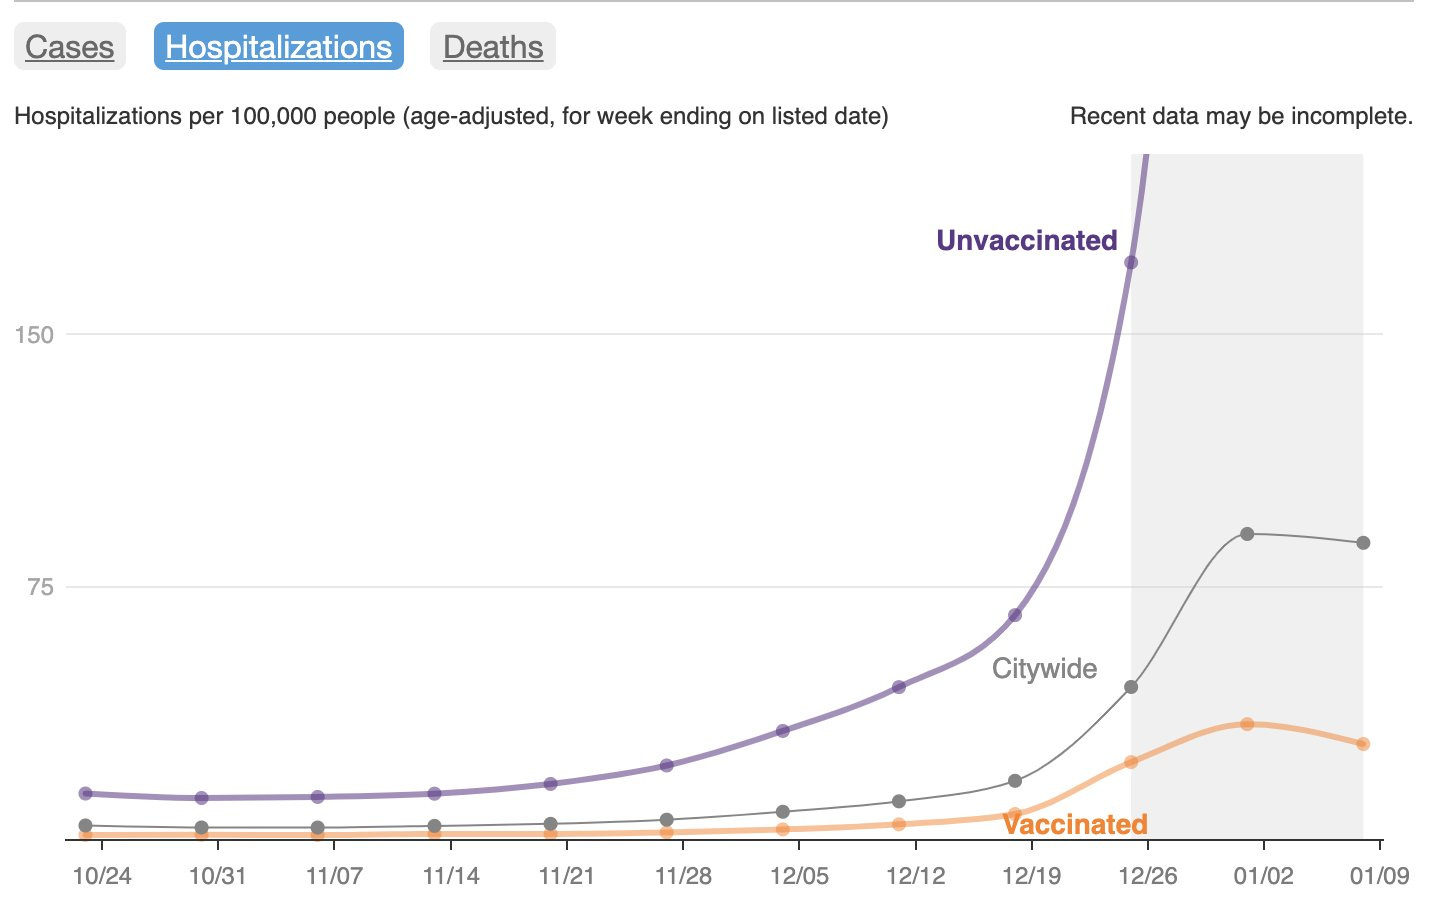
Thankfully, CDC finally updated their data and, on a national level, the relationship couldn’t be more clear: In December, compared to fully vaccinated persons, the monthly rates of COVID-19-associated hospitalizations were 16 times higher in unvaccinated adults.
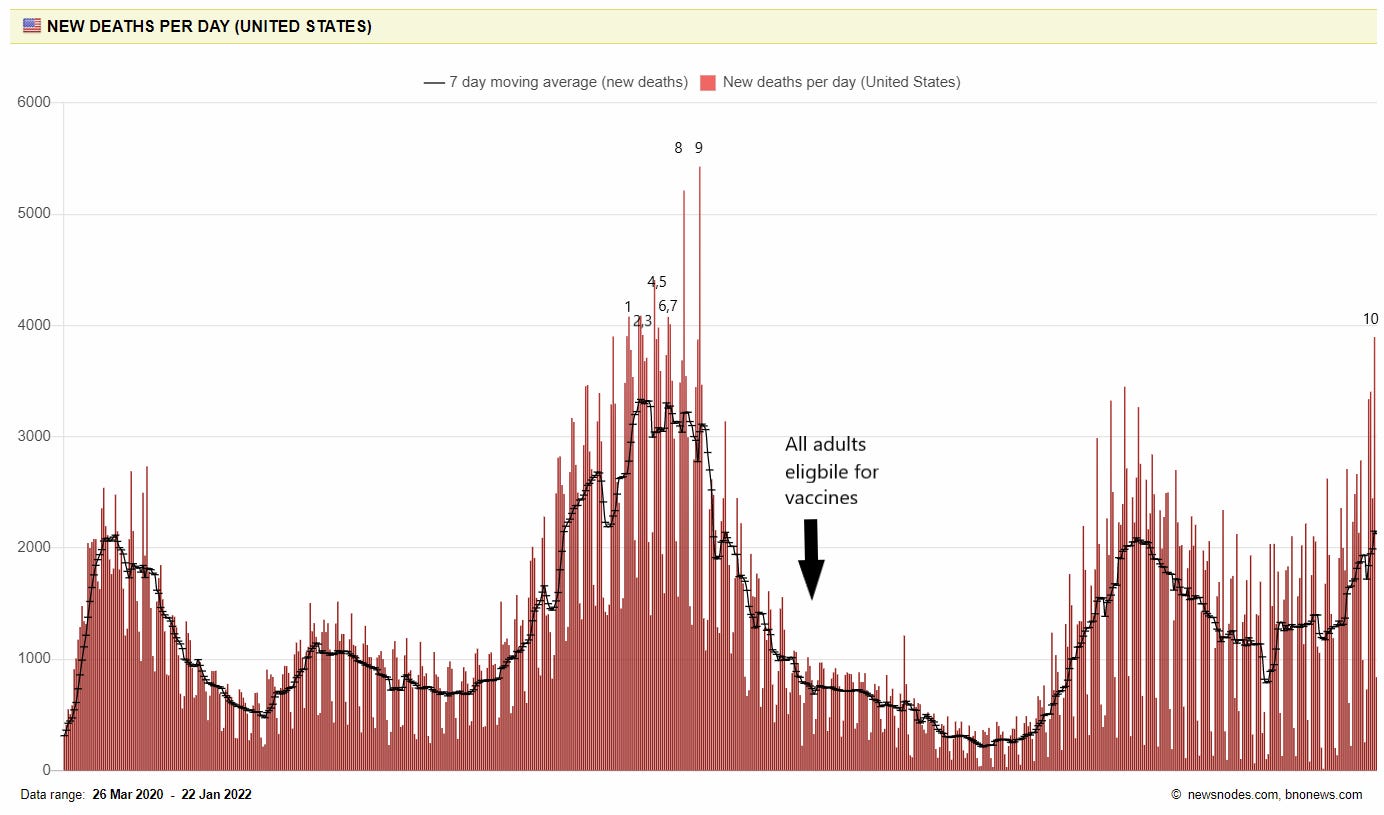
Deaths have increased 41% in the past 2 weeks. For the first time since February 2021, we reported 3,896 COVID19 deaths in the United States. This made last Friday the 10th deadliest day of the whole pandemic and the deadliest since vaccines were widely available to Americans. We are losing more Americans each day to COVID19 than we did during 9/11. And the biggest tragedy is that COVID19 death is preventable— vaccines reduce the risk of dying by 68 times. Omicron may be milder compared to Delta, but it’s not mild.
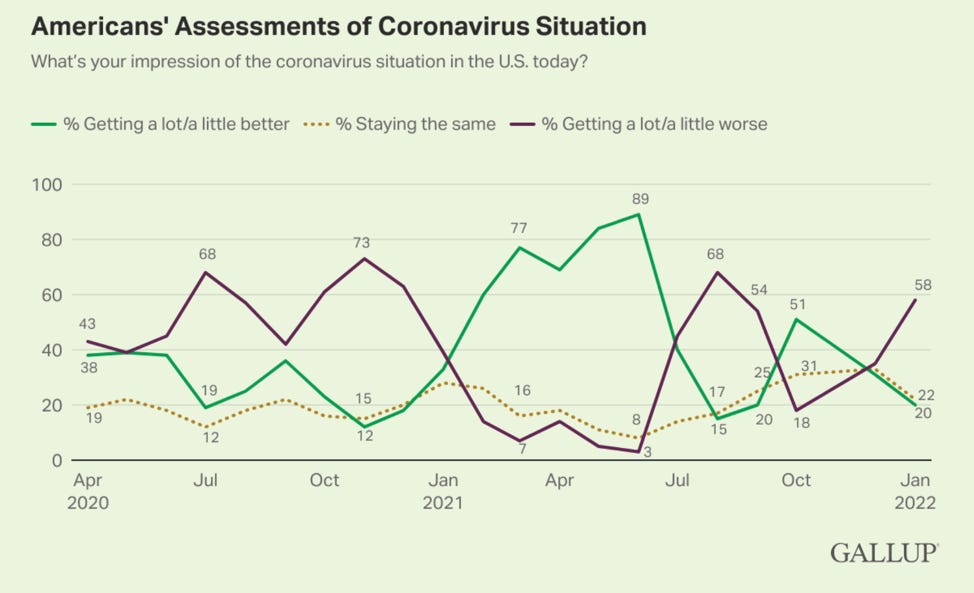
Taken together, this probably explains why the majority of Americans see the COVID19 situation as “getting a lot” worse lately.
Bottom Line: The Omicron wave is peaking across much of the globe, but this may be drawn out due to a new sister mutation called BA.2. As expected, hospitalizations and deaths are closely following. Hang in there, it will get better.
Love, YLE
“Your Local Epidemiologist (YLE)” is written by Dr. Katelyn Jetelina, MPH PhD—an epidemiologist, biostatistician, professor, researcher, wife, and mom of two little girls. During the day she has a research lab and teaches graduate-level courses, but at night she writes this newsletter. Her main goal is to “translate” the ever-evolving public health science so that people will be well equipped to make evidence-based decisions. This newsletter is free thanks to the generous support of fellow YLE community members. To support the effort, please subscribe here:
Wonderful summary, as always. Many at Yale follow your posts and rely on your clear explanations!
Sharing this feedback on today's post from Nate Grubaugh from Yale School of Public Health, who is tracking variants super closely, sequencing many samples and reports out here: https://covidtrackerct.com/variant-surveillance/ and on twitter @NathanGrubaugh. Evolving situation, for sure.
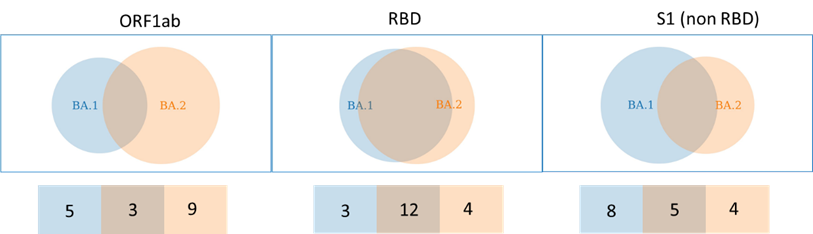
"As I mentioned during our meeting, while BA.2 is quite divergent from BA.1, it has a very similar receptor binding domain (RBD).
Two minor points.
I wouldn't call this "stealth Omicron" as we can use the lack of SGTF to identify it as Delta gets pushed out, but I understand their point.
I also disagree with the hypothesis that BA.1 or BA.2 are the result of evolution in animal reservoirs and additional spillover into humans. Omicron, as more of an upper airway infection, appears to be highly adapted for human-to-human respiratory transmission. In non-human animals, SARS-CoV-2 is probably not a primary respiratory pathogen, more likely fecal-oral. Based on other coronavirus evolution in animal reservoirs/intermediate hosts, what emerges is more of a lower respiratory tract infection, not upper.
Best,
Nate
I’m skeptical that Canada is “plumetting”. We may be going down or plateauing but no one knows the real numbers since some provinces have stopped testing people as they are running out of resources. So in my province only specific people (health workers, seniors homes, public institutions) can get tested and consequently are reported. There is no telling how many infected people are unaccounted for. So the only numbers we have are hospitalizations and deaths, the former of which is only now slowly going down. Just wanted to clarify that. And I do have a question, in instances like ours where majority of population are not being tested, is the positivity rate still a good metric to look at? I’ve been wondering as that is slowly decreasing as well.
Thanks so much for all you do!!!!