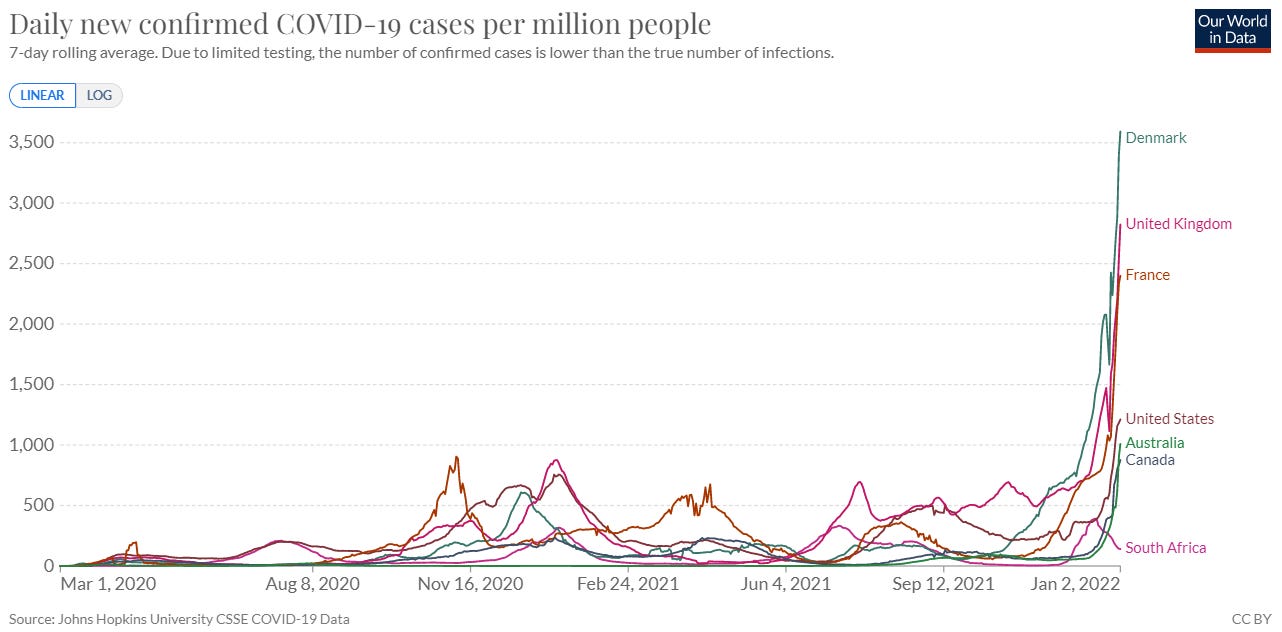
Did you blink? If so, you may have missed Omicron springboard us into a hyperdrive tsunami of cases. For the first time during the pandemic, the world reported more than 1 million confirmed cases per day. Omicron leaders, like Denmark and the UK, haven’t peaked yet, and other places are just starting their wave, like Australia and India. Interestingly, South Africa is taking longer to descend than they took to ascend, which is something to keep an eye on.
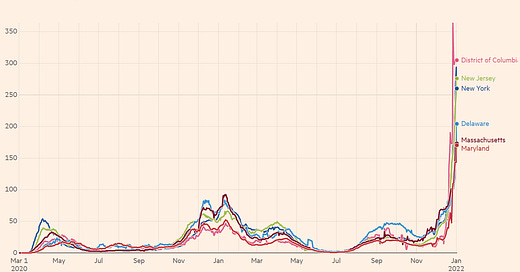
The United States reported a 204% increase in cases in the past 14 days. Our 7-day average equals 405,470 new cases each day. As a comparison, last winter we peaked at 247,000 cases per day. And while the national picture doesn’t look good, it doesn’t give hot spots justice. In the Northeast, previous waves are merely a blip on the radar now. New York has the highest case rate in the United States at a staggering 318 cases per 100,000. This is followed by Washington, DC (298 per 100K) and New Jersey (288 per 100K).
The Islands have the fastest case acceleration in the nation: U.S. Virgin Islands with a +2,385% case increase, followed by Puerto Rico (+947%). States in the South closely follow: Florida (+765%), Alabama (+759%), Louisiana (+710%), and Georgia (+704%). Time will tell how Delta’s infection-induced immunity holds up in these previously hard hit areas.
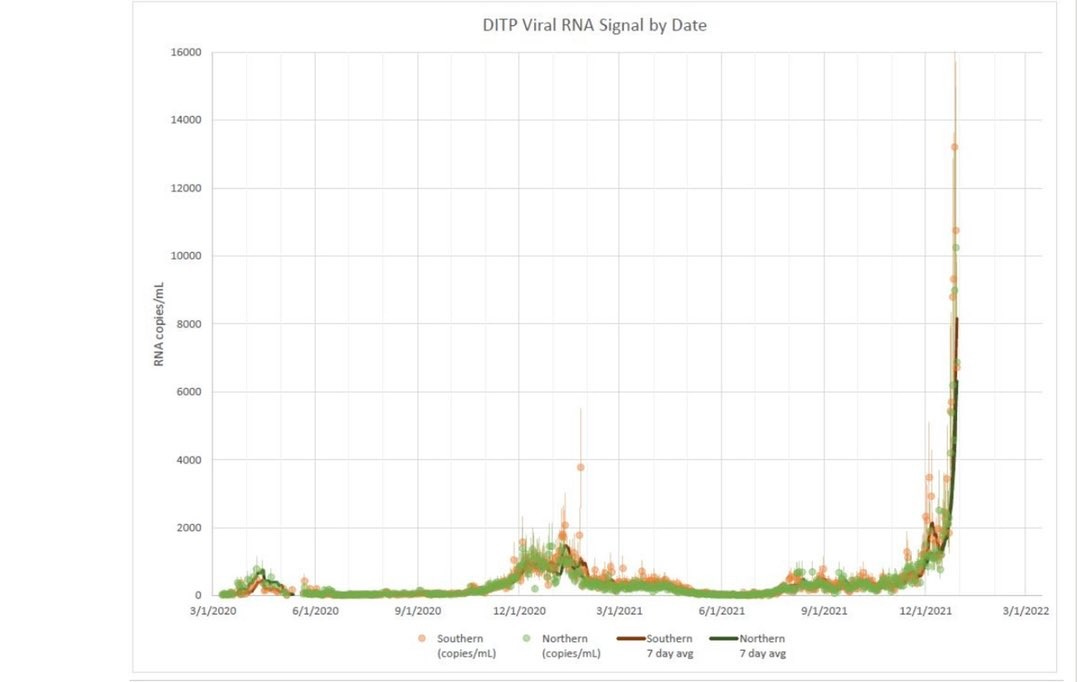
Official case rates have been an underestimate throughout the pandemic. However, we have reason to believe they’re particularly underreported now because of very high test positivity rates across the nation: Some people can’t find tests, some are testing at home and positives are not “officially” reported, and we have a lot of asymptomatic transmission. Just how much cases are underreported is a mystery. If we look at Boston sewage, though, the “true” case number is very high. When their wastewater is analyzed for COVID19, data from all past waves seems almost flat.
Hospitalizations
As expected, hospitalizations are increasing (+35% in the past 14 days), and we are currently hospitalizing 93,322 people per day in the United States. We are close to reaching Delta’s peak and have some time until we reach last winter’s peak.
In certain jurisdictions, though, we’ve met or exceeded last winter’s hospitalization peak. We can see this in many states in the Northeast, including New York. Other states that are just beginning the Omicron wave, like Florida, aren’t close yet.
While digesting hospitalizations in the coming weeks, it’s important to keep five things in mind:
Decoupling. This is the first thing you should notice: Hospitalizations are not increasing at the rate of cases. This phenomenon is due to immunity and, possibly, less severe Omicron. We are VERY lucky this kicked in now. However, the question remains: What is the health and societal impact of a 50% reduction in hospitalizations among a virus that is probably as contagious as measles? TBD.
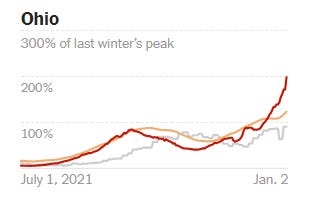
Delta. Ohio has one of the highest hospitalization rates right now (50 per 100,000 people), but only has modest case growth (+90% in past 14 days). Indiana is showing a similar pattern. This is an indication that hospitalizations in some states are still from Delta not Omicron. Whether Delta sticks around (or comes back after Omicron) is yet to be determined.
For vs. with COVID. The U.S. is notoriously bad at tracking real-time data, so almost all hospitalization records pool “with COVID19” and “for COVID19.” Jackson Health System, though, has been doing a fantastic job differentiating between the two. Today they reported 50% of their hospitalizations are “for COVID.” Other systems are reporting much higher rates of hospitalization for COVID, like 4/5. While this distinction is important for understanding Omicron severity on an individual level, it doesn’t really matter to the health system (see “Disruptions” section below for more).
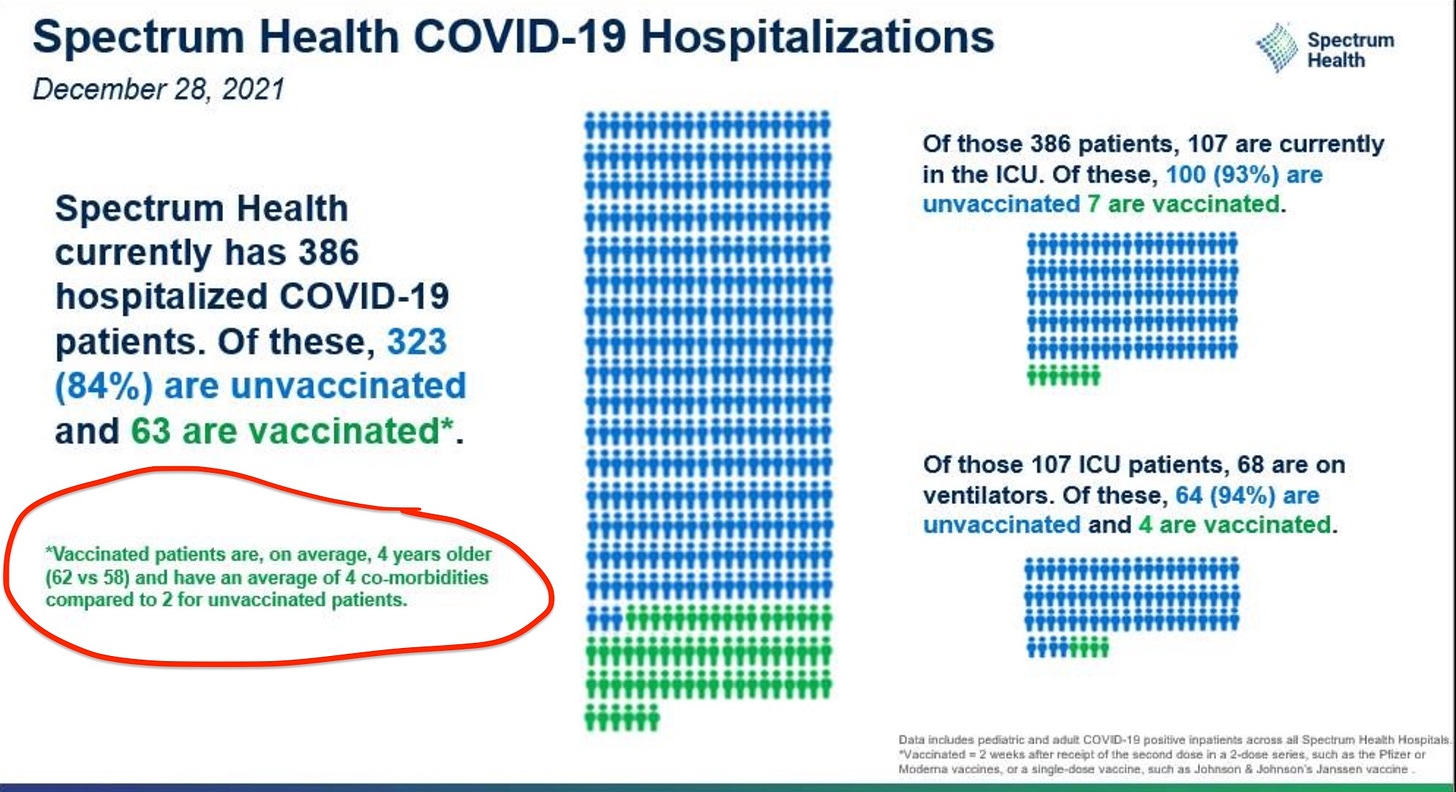
Unvaccinated. It’s clear that hospitalizations continue to be largely driven by unvaccinated cases. The CDC hasn’t published stratified data since mid-November, so we rely on smaller jurisdictions to monitor the relationship between severe disease and vaccination. Spectrum Health (a hospital system in Michigan) published a really nice graphic below. You’ll notice there are some vaccinated people in the hospital and ICU, albeit at a much smaller rate. An important caveat is included in the red circle: the vaccinated people are older and have more comorbidities than the unvaccinated. The state of New York is also doing a great job keeping track of this (but a bit more lagged).
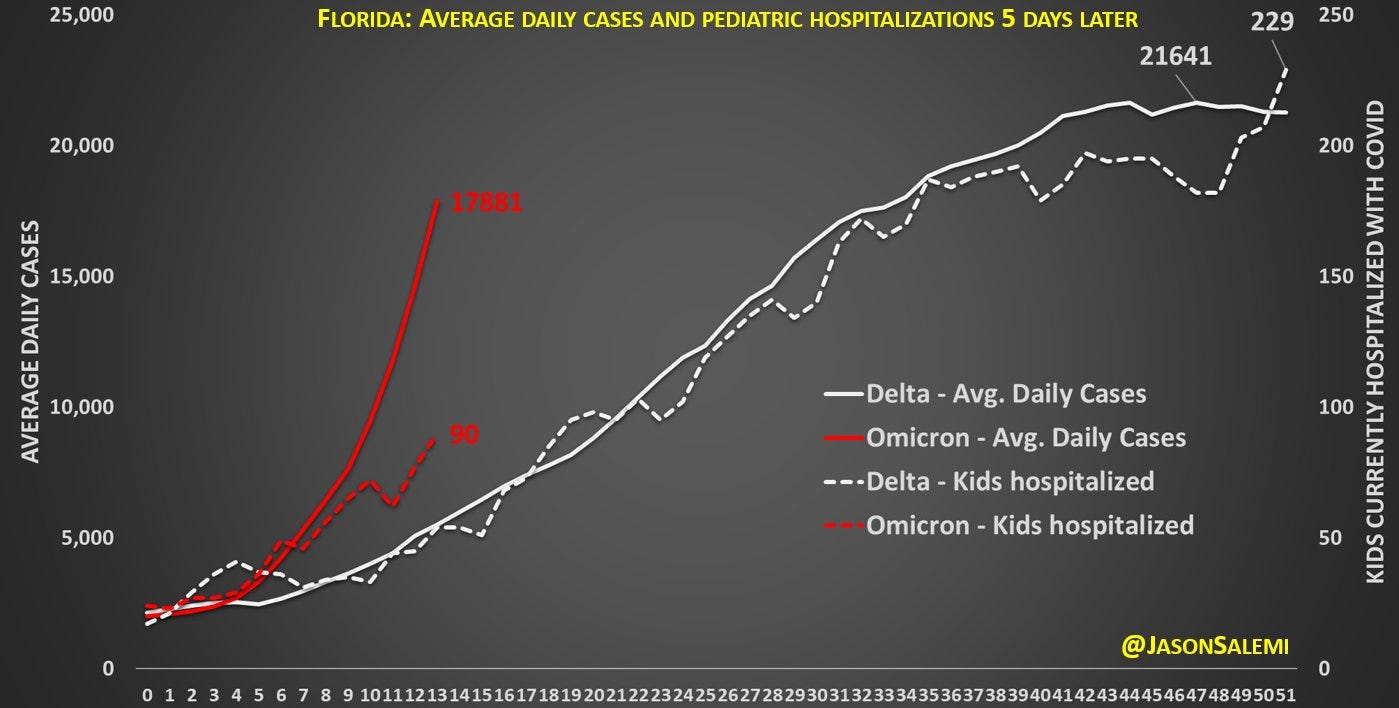
Pediatric hospitalizations. Kids in hospitals also continue to increase because, well, they’re unvaccinated. We can see this easily in many graphs (like on the CDC website) but I found the one below from Florida most useful because it compared Delta to Omicron. Get your kids vaccinated! Those aged 12+ can (hopefully) get boosted by the end of the week.
Disruptions
We are starting to see the highly transmissible variant impact almost everything else in our community, too: food supply (agriculture, grocery stores, truck drivers), travel (air, train, bus), essential services (healthcare, emergency services), and education (teachers, bus drivers).
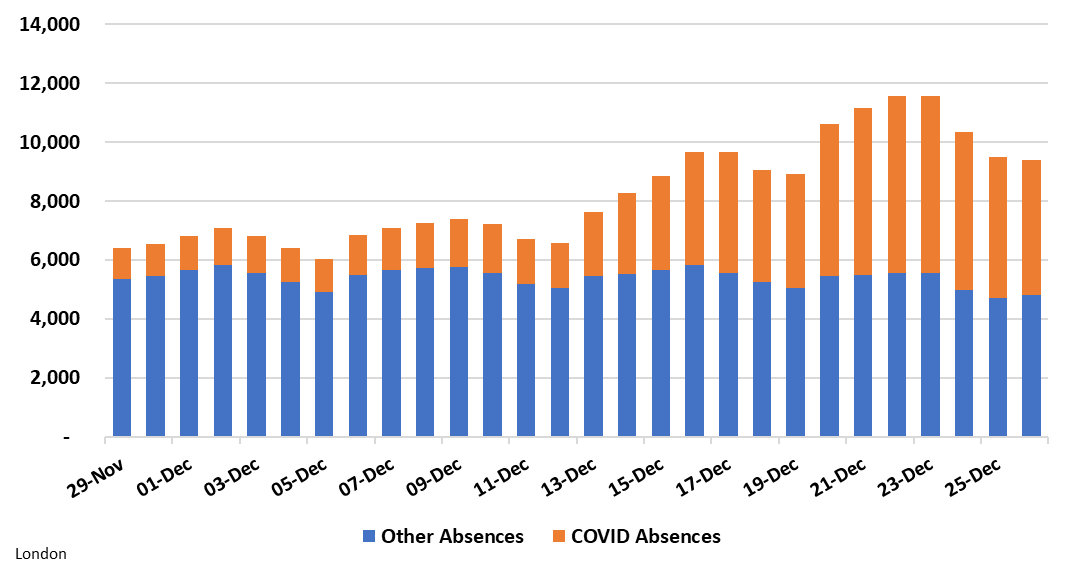
For example, the number of healthcare workers out sick with COVID19 continues to increase. Below is a graph from London displaying the number of staff absent due to COVID19 (orange) compared to other reasons (blue). It’s important to recognize that this is where hospitalizations “with COVID” vs. “for COVID” doesn’t matter: Patients in the hospital, regardless of what they are there for, are infecting the workforce (and other patients).
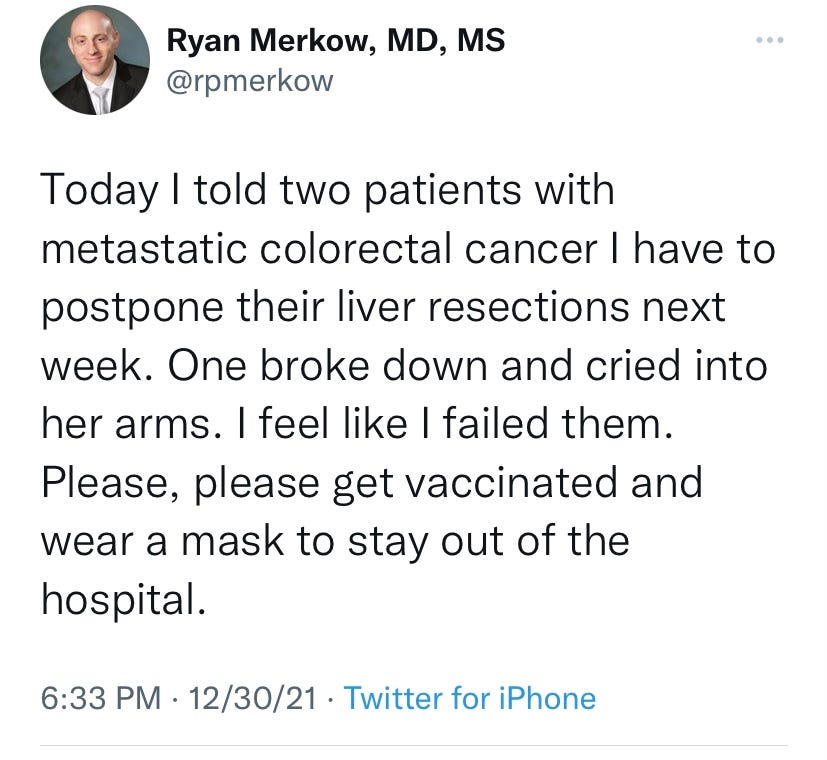
A strong and resilient health system is crucial not only for treating the onslaught of COVID19 but for many other health concerns, too. Here is some anecdotal evidence from those on the front line:
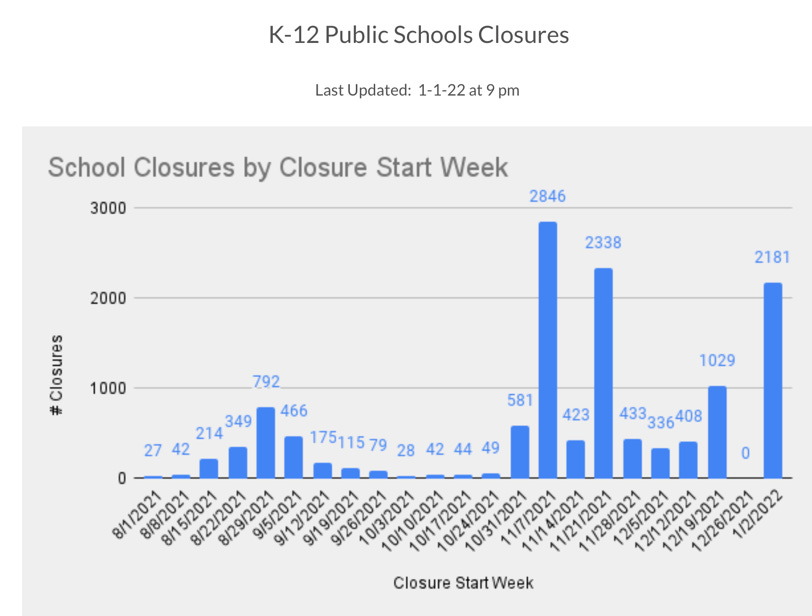
Another example is education disruption. Burbio, a database of K-12 schools across the nation, just updated their data and found the 2022 year isn’t off to a great start for schools. Many schools in places like NYC are closed this week due to staffing shortages. Schools in Seattle are delaying reopening so students can test for COVID19 before returning. Others, like schools in Atlanta, are temporarily going virtual. Schools in Iowa were cancelled because of lack of bus drivers.
Bottom line: We saw the Omicron surge coming, but to see the situation unfold in real time is mind blowing, exhausting, and epidemiologically fascinating. The tsunami of cases is something we’ve never seen before. And while we are very lucky hospitalizations have decoupled, the vast spread has yet to show its colors in terms of morbidity and mortality. I hope this is also a reminder to all that a healthy economy is based on healthy people. Those that silo the two are gravely mistaken.
Love, YLE
P.S. You’ll see another variant pop up in the news called B.1.640.2. This variant arrived before Omicron, as the WHO classified it as a “Variant Under Monitoring” in November. It hasn’t done much (there are only 20 cases sequenced worldwide compared to more than 120,000 Omicron cases in less time). We are not worried about it at this time.







That sewage data from Boston is absolutely astounding. Do we know if fecal viral load is higher for Omicron than for previous variants? Consequently, do we think that the RNA count in the sewage is directly proportional to cases across waves, or that some sort of correction factor would be needed to compare population case count from sewage results between periods where different variants dominated?
Happy new subscriber here! Wonderful post. Many thanks. Heartened to see the hospitalized vaxxed are trending older and/or with more co-morbidities but it Makes me wonder whether you think we need to start fourth shots for people (like my parents in the 75+ crowd) who were boosted as early as first week if September and don’t have great ability to mount robust tell etc response