Si quiere leer la versión en español, pulse aquí.
This is a deep dive into the epidemiology of COVID19 indicators among kids in the wake of Omicron.
In this post, I frame the data a little differently to address “numerator thinking” vs. “denominator thinking.” Dr. Lindsey Leininger (a Dartmouth-based policy expert and co-founder of Dear Pandemic) recently introduced this perspective to me, and it was incredibly eye-opening. In fact, I think explains why there is substantial disagreement throughout the pandemic on almost everything. This is particularly the case in regards to the perception of the threat SARS-CoV-2 has on children. Numerator people don’t agree with denominator people and vice versa. Here is the difference between the two:
Numerator thinking: A heavier lens on the absolute numbers—How many children are hospitalized? Is this number increasing? How many children have died?
Denominator thinking: A heavier lens on the population in which the numerator arises—How many children have died compared to adults? How many myocarditis cases per 1,000,000 doses?
One puts weight on each differently based on history, background, culture, employment, and context. For example, clinicians care for these patients every day, and the numerator is top of mind. As a parent, having my kid in the numerator is not comforting even if the probability of that happening was small. Policymakers, on the other hand, need a more denominator-oriented perspective. But, everyone needs to consider both elements. Here I present both perspectives in an attempt to paint a comprehensive picture of the current state of affairs of children with COVID19.
Cases
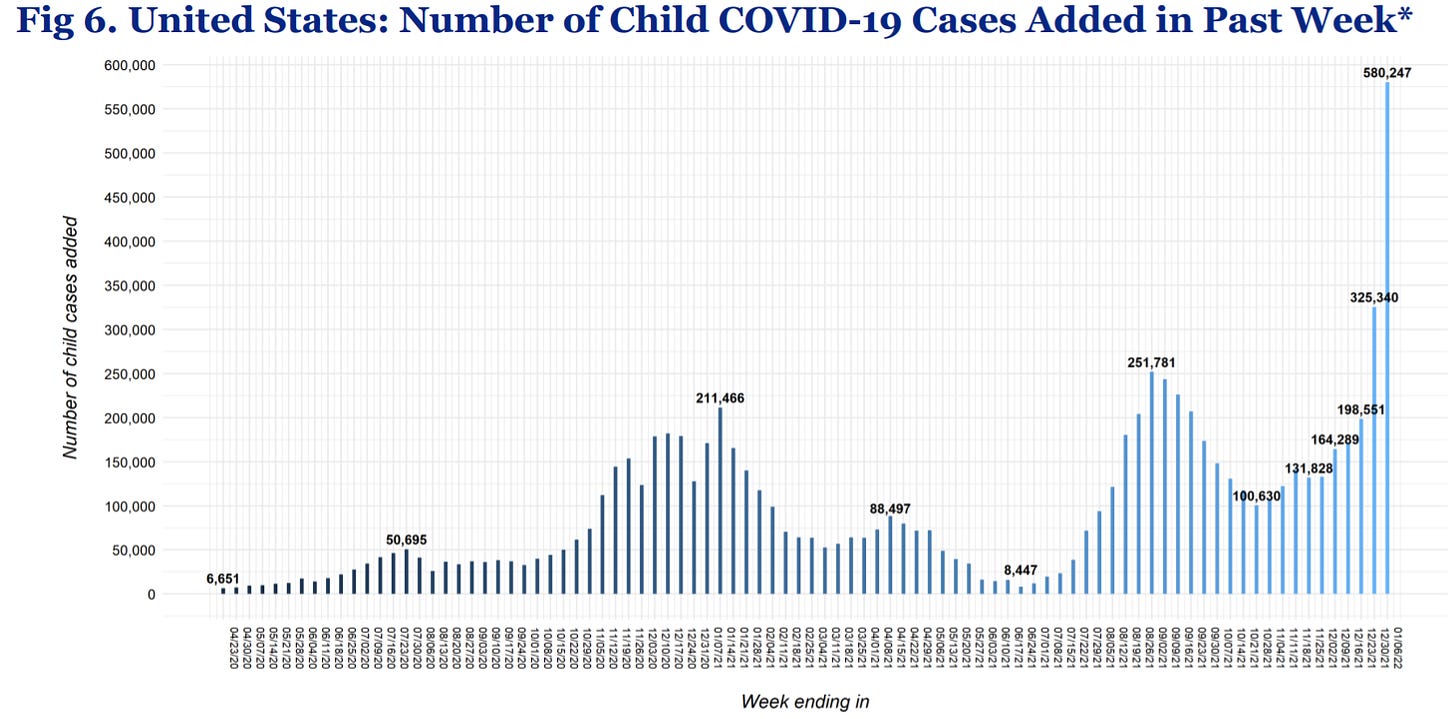
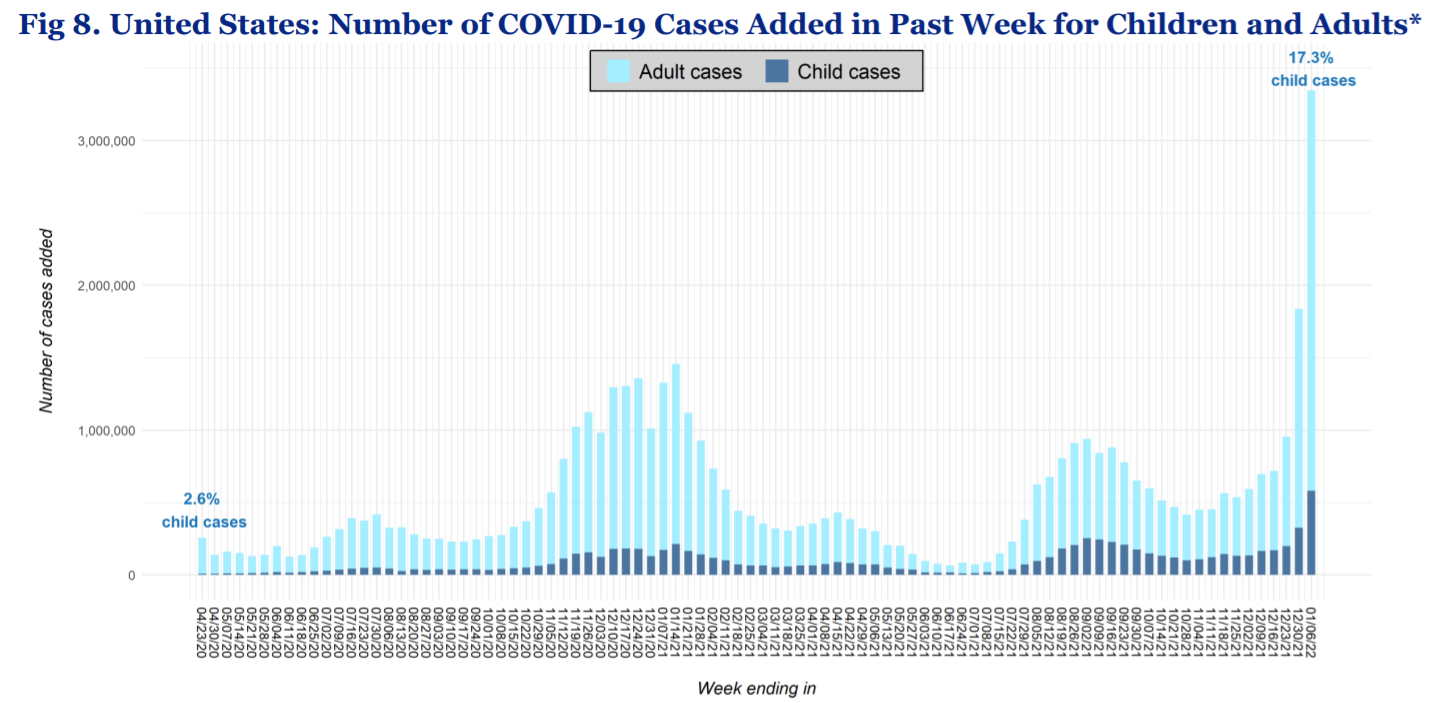
Numerator: Pediatric cases are skyrocketing to levels we’ve never seen before. Today the American Academy of Pediatrics reported 580,247 cases in the past week—a raw number record and the highest week increase to date. A number that makes previous waves look like nothing.
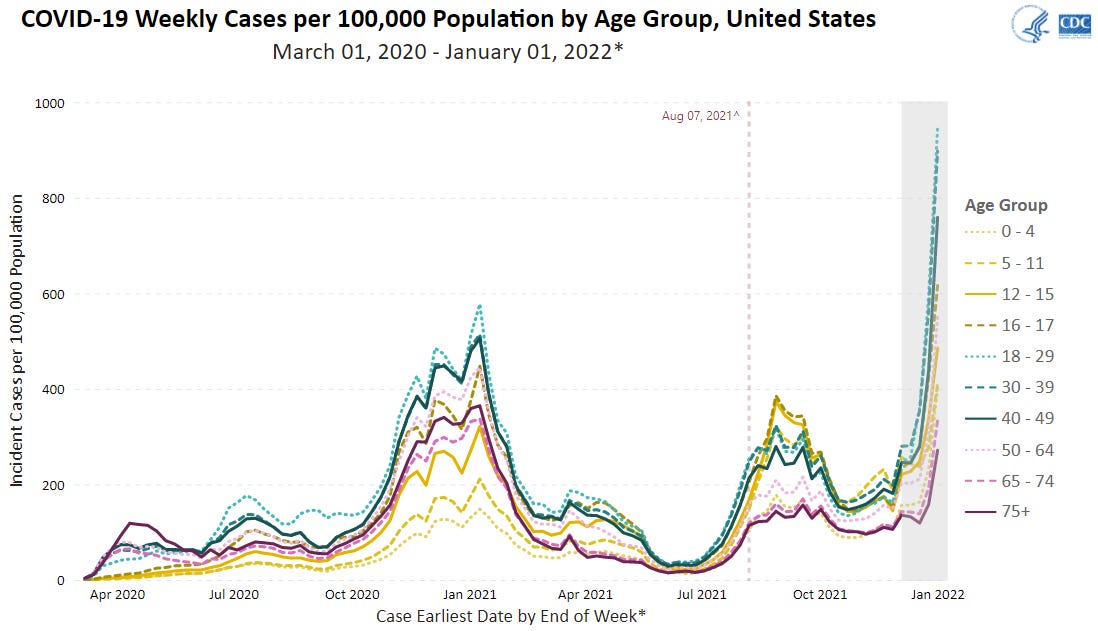
Denominator: Cases, regardless of age, are skyrocketing. Below is the latest CDC graph of cases by age group over time. Interestingly, you’ll see that this pattern has shifted throughout the pandemic. For example, last winter, children were the lowest case group. During the Delta wave, kids were the case leaders (maybe because schools opened). In the Omicron wave, pediatric numbers are in the middle of the pack: The case leaders are those aged 18-49 years, followed by children (0-17 years) and then the oldest groups (50+ years).
Children make up 17.3% of cases, and this proportion has increased over time. This is due to many factors, including more adults getting vaccinated. Also, over time, more and more kids have less of a protective bubble, like no virtual learning, more social activities, etc.
Hospitalizations
Numerator: Pediatric hospitalizations are also increasing. And they are increasing fast. In the figure below, hospitalizations among children aged 0-17 year increased to numbers never seen before, a daily rate of 1.13 new admissions per 100,000 children.
Denominator: When we compare this to other age groups, the number of admissions among 0-17 year-olds continues to be the lowest compared to any other age group. Every age group is increasing in hospital admissions right now.
Another perspective is comparing to hospitalizations for other viruses. I combed through the literature and created the table below. For children under 5, respiratory syncytial virus (RSV) has the highest rate of hospitalization (as a society, we don’t give this virus enough credit), followed by SARS-CoV-2 and influenza. This pattern is reversed for children aged 12-17: SARS-CoV-2 is the leader followed by RSV and influenza. Thankfully we have a vaccine for the flu. We also have a vaccine for COVID19, but this isn’t comforting for us parents with kids under 5 who are still waiting.
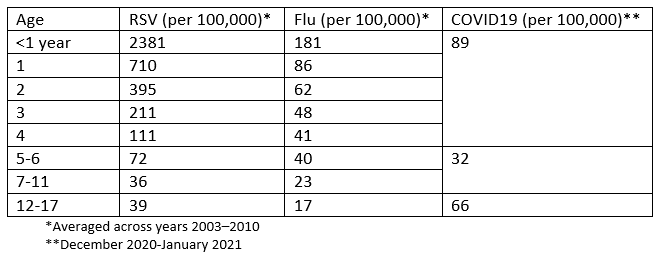
Given our suboptimal surveillance system, we really only have rate of hospitalization for COVID19 on a national level. For more granular data we rely on specific jurisdictions. For example, the New York State Department of Health provided a lot of important context into these hospitalizations over the weekend:
Admissions are increasing for children aged 0-11 years. Admissions have increased 48-72% among unvaccinated children aged 0-11 years in the Omicron wave compared to the Delta wave. This isn’t the case for unvaccinated children aged 12-17. This could be a sign that Omicron is not milder among the youngest of children.
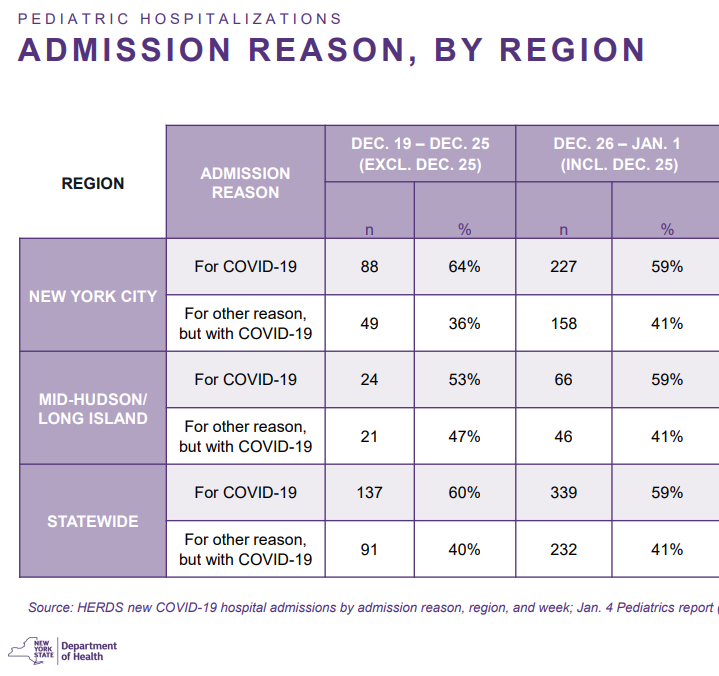
“For” or “with” COVID19. There has been a lot of public interest in whether children (and adults) are hospitalized “for COVID19” or “with COVID.” While this doesn’t matter for some questions (like, hospital capacity or hospital acquired infection among vulnerable and staff), it’s important for other questions (like, severity of Omicron among kids). In the state of New York, 59% of kids admitted who have COVID 19 are hospitalized for COVID19. Without historic data, it’s hard to know what this means. But it certainly does not mean dismiss the other 41% (hospitalizations “with COVID19”). Clinicians on the ground are describing a third category: “COVID19 exacerbating medical conditions.” For example, if a child has diabetes, COVID19 infection significantly complicates the disease and the child is hospitalized. This is very different than a child with a broken bone that happens to test positive. This third category isn’t displayed widely and cannot be ignored.
Underlying conditions. In New York State, 53-63% of children hospitalized with/for COVID19 did not have underlying health conditions. This is consistent with previous reports from the CDC. Severe COVID19 disease among children can be random.
Long COVID
Numerator: In the United States, we do not have a good grasp of the prevalence… at all. But, the U.K. has fantastic surveillance. Using their data from Office of National Statistics, before Omicron, the rates of long COVID19 continued to increase. In November 2021, more than 20,000 children had COVID19 symptoms for longer than 12 months. With more cases comes more long COVID19.
We do not know the impact of Omicron on long COVID19. It could be less prevalent because the viral load is reduced or it could be more prevalence because the disease process is different. We don’t know.
Denominator: Thankfully, long COVID19 is less prevalent among kids compared to adults. Finland conducted a study and found the prevalence of long COVID is reported among 50% of infected adults and 2% of kids. This is consistent with research out of the UK showing that long COVID19 is present in fewer than 2% of the population.
Death
Numerator: Among the states that report deaths by age (46 states and NYC), a total of 747 children have died from COVID19 during the pandemic. Once we account for state’s missing data, an estimated 812 children have died from COVID19 in the U.S.
Denominator: Pediatric deaths account for 0.10% of deaths overall. In other words, there are far more adults dying from COVID19 than children.
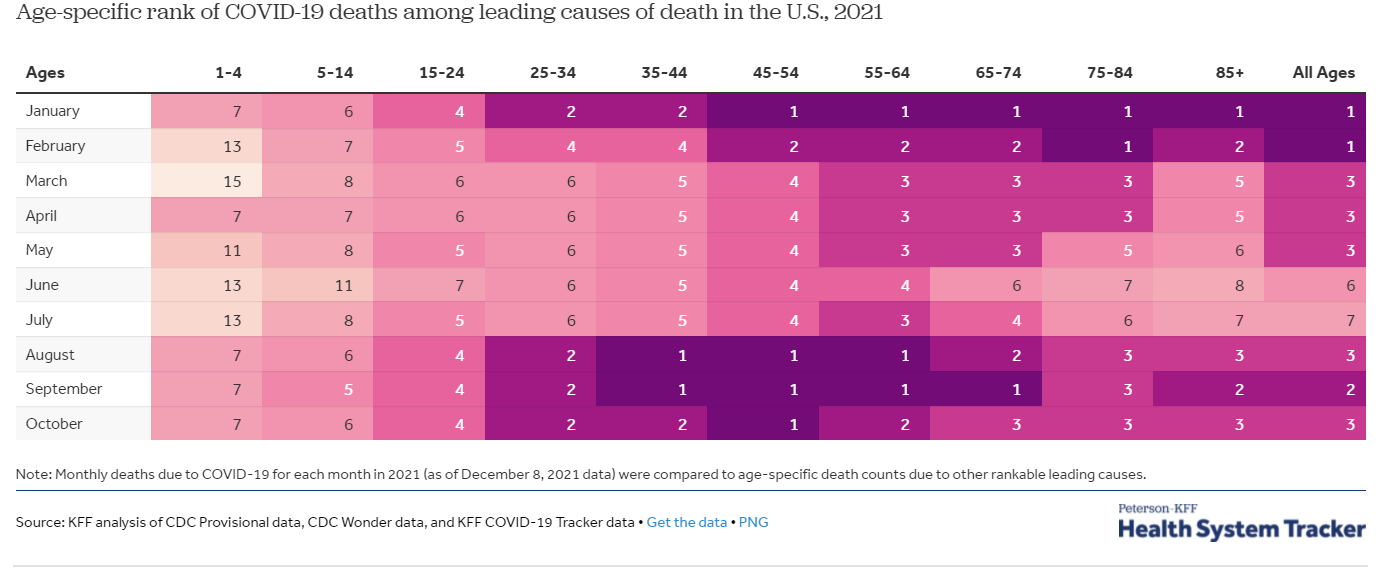
There is another important denominator to consider. Comparing kids to adults can be inherently flawed because kids don’t die as often as adults overall. If we change the denominator to children, COVID19 is a top 10 leading cause of death. The Kaiser Family Foundation presented the age-specific rank of COVID19 deaths among leading causes of death in the US. The rank of COVID19 was dependent on the month (and thus, whether we were in a wave or not).
Vaccines
Numerator: More than 8.6 million children aged 5-11 years and 18.7 million children aged 12-15 years have at least one dose in the United States. As of December 19, this resulted in 12 reported cases of myocarditis among children aged 5-11 years and 265 reported cases of myocarditis among children aged 12-15 years.
Denominator: Not nearly enough children are vaccinated. There are 28 million 5-11 year olds in the United States, so this means we have a vaccination rate of only 31%.
The myocarditis cases are unfortunate but incredibly rare: 12 cases arose from 8.6 million vaccinated younger children and 265 cases arose from 18.7 million vaccinated older children. This equates to 4-70 vaccine-induced myocarditis cases per 1,000,000 doses, depending on age and sex.
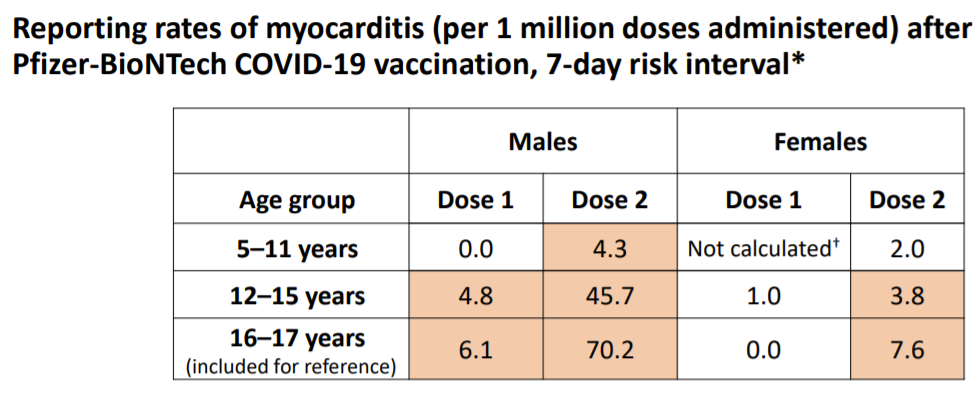
But “number of doses” isn’t the only denominator to take into account:
Infection-induced myocarditis (heart inflammation caused by COVID19 infection, not vaccines) rate is 40 per 1,000,000 among those under 40 years old. So, in most cases, myocarditis is more common from COVID19 than vaccines. But, even among groups where this isn’t the case, the denominator is flawed, as the symptoms of myocarditis from infection are far more severe than the symptoms of myocarditis from the vaccine.
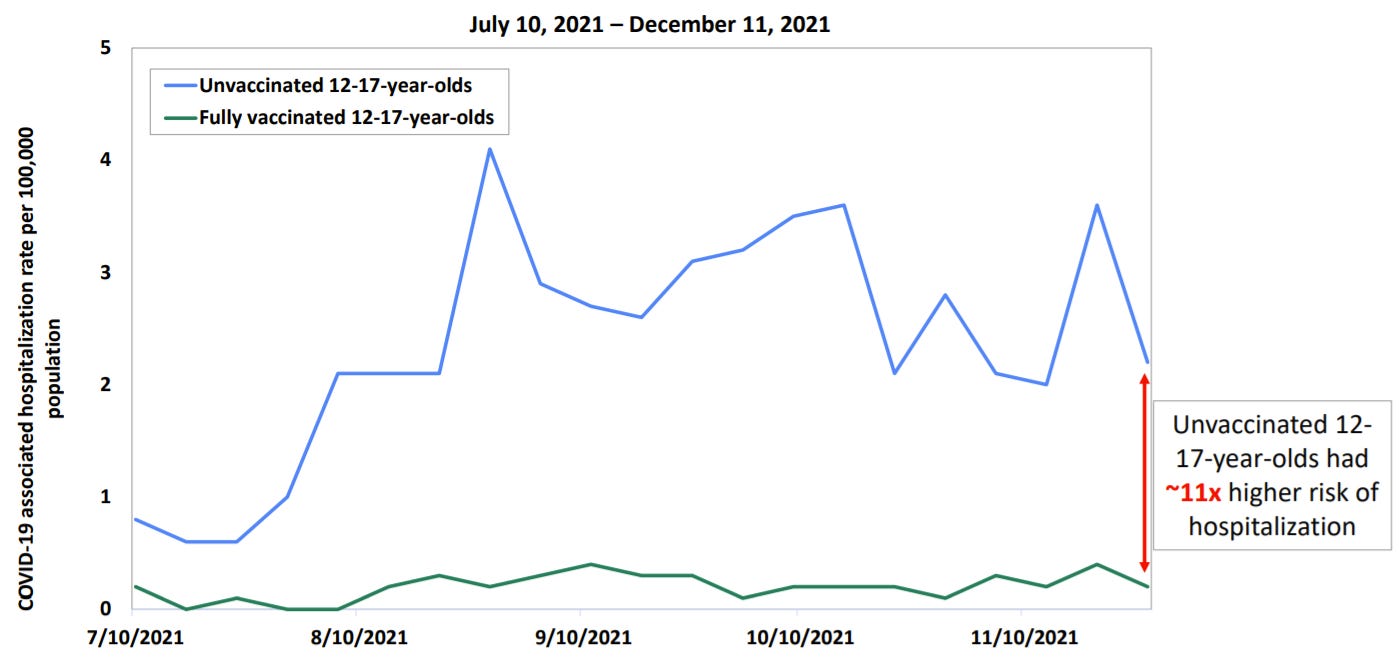
Also, myocarditis isn’t the only outcome to pay attention to. Vaccines are working incredibly well for kids against hospitalization and death. Before Omicron, unvaccinated children aged 12-17 years had 11 times higher risk of hospitalization than their vaccinated peers.
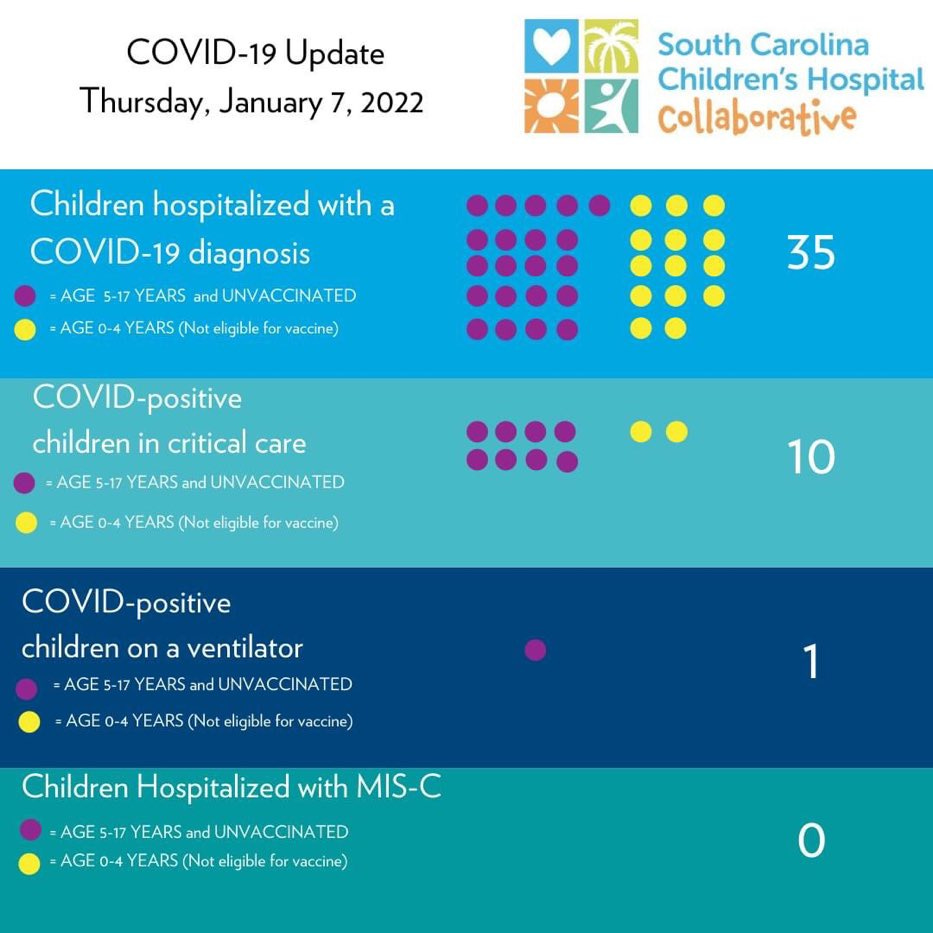
We are seeing this in local jurisdictions, too. In a South Carolina Children’s hospital, all children hospitalized with/for COVID19 were unvaccinated. Every one of them. In the state of New York report, 91% of children aged 5-11 years who were hospitalized with/for COVID19 were unvaccinated.
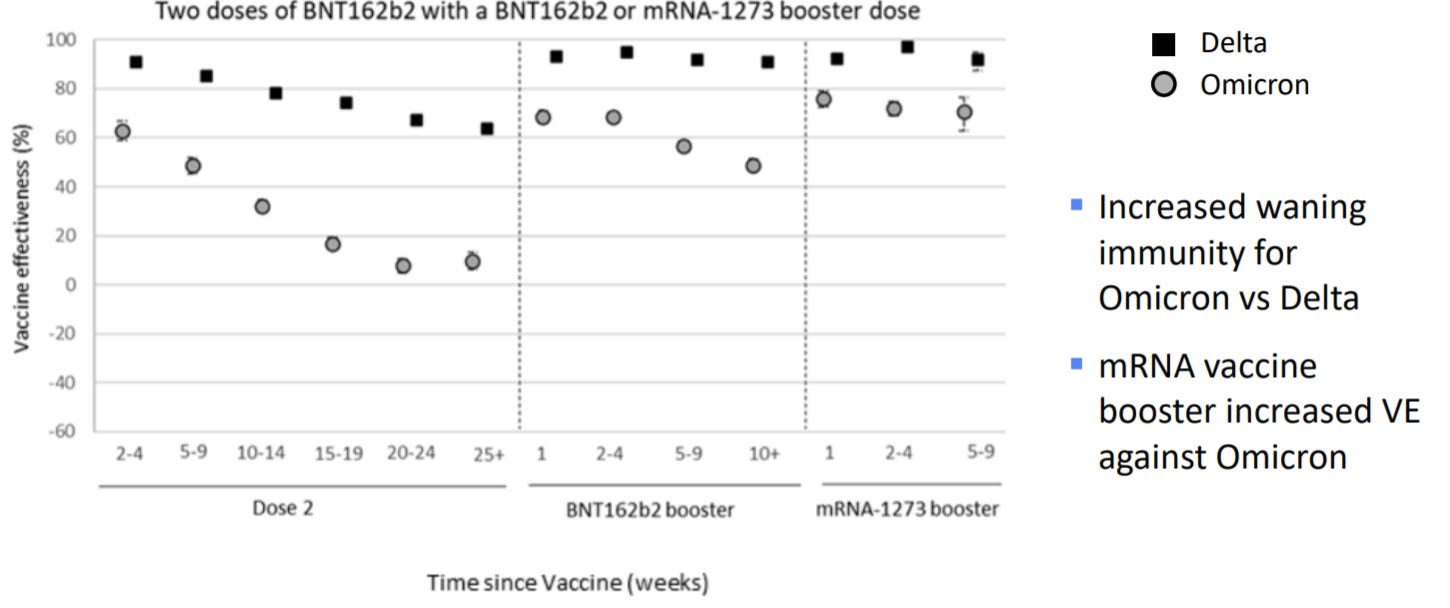
Unfortunately, we have evidence that the original vaccine series is waning. This means the vaccine efficacy against infection is decreasing over time. We saw this in adults, and now we are seeing this with our 12-15 year olds. This was true before Omicron, but Omicron is speeding up the waning. We lean on data from the UK to see this effect in near-real time (see below). This is why last week, the FDA and ACIP recommended that everyone 12+ years should get a booster (versus may get a booster).
Bottom line: Children are not spared by this virus. Omicron has certainly put this in overdrive. We cannot discount the numerator. But we also cannot ignore the denominator—overall healthy children fare much better than adults.
There are a lot of people making really difficult decisions right now (parents, teachers, policymakers, etc.). As a parent of 2 under 3, a recent Slate headline (and article) resonated with me: “The Agony of Parents With Kids Under 5”. This landscape is complicated and hard. We need to approach everyone’s decisions with empathy and recognize how (and why) people may put more emphasis on numerators or denominators.
Love, YLE
Thank you, also, to Dr. Jenn Dowd a brilliant epidemiologist at Oxford and author at Dear Pandemic for helping think through this important epidemiological perspective!




It is always harder to act on a proposition than to take a passive stance. If something bad happens because we took an action, it feels like we are responsible. No parent wants to hurt their child, and even if there is a tiny chance of causing harm it is understandable why up to a third of American parents aren't getting their kids vaccinated voluntarily.
But unfortunately we are just as responsible for not acting. Seeing your child get sick, and worrying how bad it might get, and worrying about who else is about to get sick, should compel us to take control and choose the less risky proposition.
I’m sticking with the AAP, AAFP, FDA, and CDC recommendations, and an old school respect for expertise... and your post here reinforces all that! Thank you.
Thanks for a great article--as a pediatrician, I actually try to balance both numerator and denominator in helping my parents make decisions--such a tough time right now! I would love to hear more about type 1 diabetes risk post-COVID--but there may not be enough data to address this yet...