
Texas Hospital Capacity
Texas hospital capacity.
Here is the updated data. Both per capita (COVID19 hospitalizations per population) and capacity per TSA region.
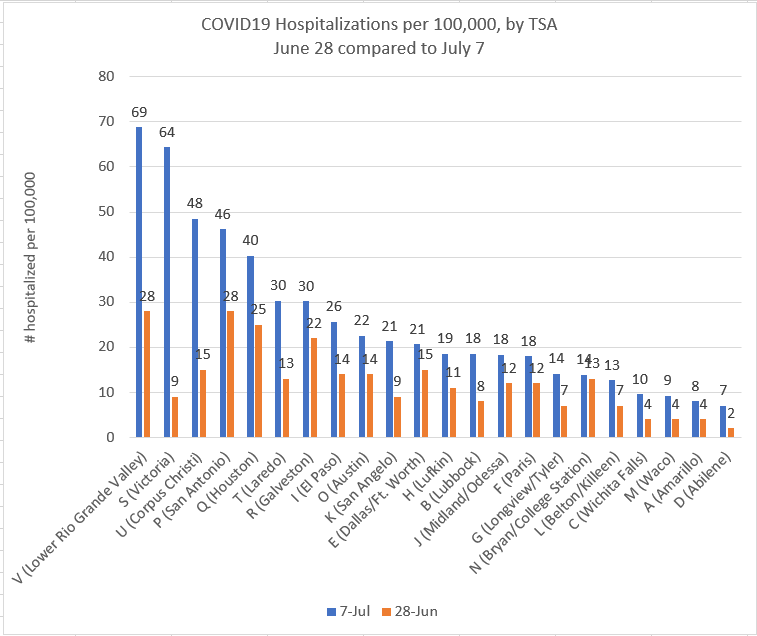
It's been 9 days since my first hospital capacity post (June 28) and we can see dramatic differences in numbers (look at the orange in Figure 2 compared to Figure 3). This can change FAST.
As a reminder...
-COVID19 (for hospital data) is defined as confirmed and probable (see previous posts for the definition of probable)
-A hospital bed can only be "avaliable" if staffed
-Capacity INCLUDES open and staffed surge units. So we will likely never reach "100%", unless we run out of stadiums or staff first. However, given that capacity is over 90% AFTER including surge units is... interesting
-Including surge units also probably explains why we DONT see changes in orange in some places, like DFW. This is likely due to surge units opening up at the same rate as COVID19 hospitalizations, NOT because hospitalizations have remained steady over the past 9 days.
-We are updating our dashboard to include this graph (along with other things). You will have this data soon (and I don't have to keep re-posting updates).
Love, your local epidemiologist
Data Sources: DSHS, figures by me