Si quiere leer la versión en español, pulse aquí.
Wastewater-based epidemiology (WBE) has recently gained significant attention. And rightfully so, as it’s being conducted at over 3,000 sites in 58 countries across the globe. But in the U.S., active wastewater surveillance for SARS-CoV-2 is only done in some states and to varying degrees. Last Friday, the CDC showcased our system by adding wastewater surveillance to the COVID-19 dashboard. (This dashboard is not entirely inclusive and will continue to be updated.)
Wastewater surveillance is not new
You may be surprised to hear that SARS-CoV-2 isn’t the first time we’ve used wastewater as a public health metric. This methodology started around 1954 when epidemiologists traced cases of parasitic infections to wastewater contaminating a nearby reservoir. It wasn’t until the 1990s, though, that WBE started gaining exponential interest through research. Since, WBE has been used for monitoring and tracing a wide range of public health topics, including identifying the use and changing habits of illicit drugs, global eradication of polio, surveillance of Hepatitis E, change in dietary patterns, surveillance of pit latrines of Malawi, and more.
WBE for SARS-CoV-2 started very early in the pandemic, even before widespread individual PCR tests were available. The first sign that WBE would work with this virus was when a group of Chinese scientists published a study in the Lancet. They assessed whether the virus was present in fecal samples among 74 patients hospitalized for COVID-19 between January 16 and March 15, 2020 at a Chinese hospital. Among the fecal samples, 41 (55%) were positive for SARS-CoV-2 RNA. When the virus took hold in the U.S., wastewater surveillance work closely followed. In Boston, for example, a team of scientists started testing for COVID-19 from March 18-25, 2020. They found:
“The number of positive cases estimated from wastewater [was] orders of magnitude greater than the number of confirmed clinical cases and therefore may significantly impact efforts to understand the case fatality rate and progression of disease.”
From there on out, WBE was a very useful tool for jurisdictions. It was particularly helpful in the early days of the pandemic when there were significant limitations on individual PCR testing (and surveillance). WBE was able to provide data 0–2 days ahead of the percentage of positive tests and 1–4 days ahead of an increase in local hospital admissions.
WBE has also been heavily used during the Omicron wave, which is helpful for a number of reasons. First, more and more people have started to move toward at-home testing. Because of this, cases aren’t officially reported to state or national surveillance. Wastewater, on the other hand, captures cases as people flush their toilets.
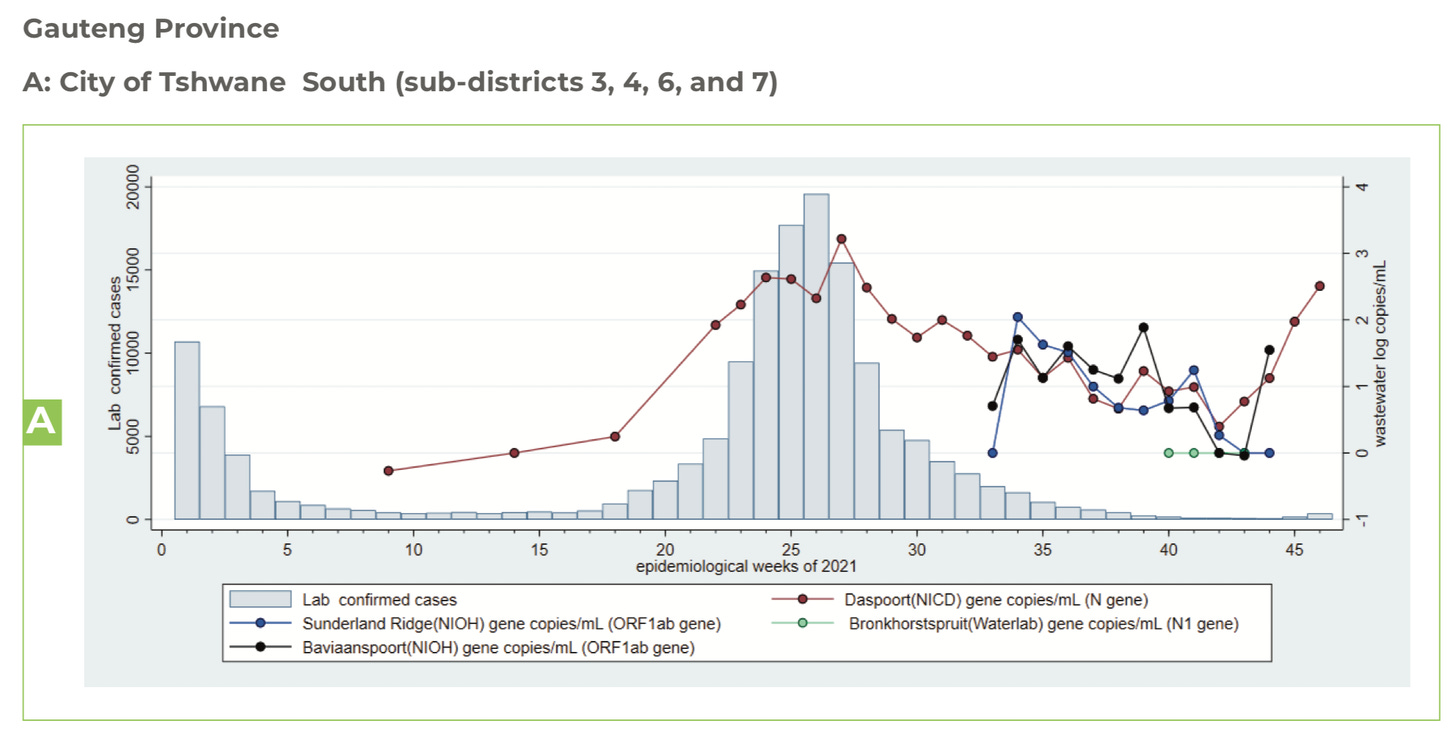
Second, WBE worked as a fantastic warning system. In fact, it was one of the first surveillance systems to predict infection uptick in the city of Tshwane (near Omicron’s epicenter in South Africa; see Figure below). Before cases rose, detection of COVID-19 in wastewater was almost as high as it was with Delta. On November 26, we knew this meant one of two things: A rise in cases was coming and coming fast; or, cases were so mild they were going undetected. Time told us it was a combination. But, because of this system, South Africa was able to warn the world of what was to come.
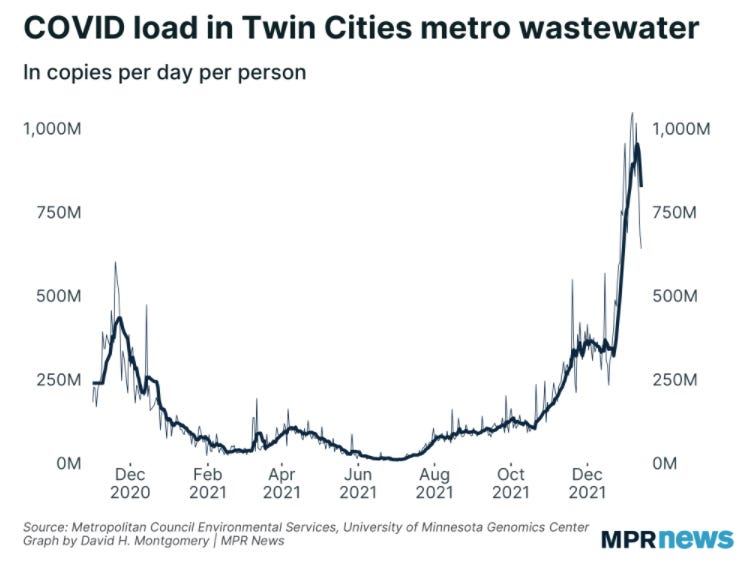
Third, WBE helped indicate when Omicron peaked. For example, officials in the Twin Cities accurately predicted the Omicron peak before cases peaked by monitoring wastewater surveillance. This was especially crucial because testing labs were backlogged for days. This phenomenon happened in Boston, too: Wastewater peaked around New Year’s, and then cases peaked 2-3 weeks later.
Benefits and limitations to WBE
As you can imagine, there are a number of benefits with WBE surveillance:
Passive. First, this is an incredibly strong surveillance system because it’s passive and anonymous. If you flush you are captured irrespective of testing behaviors, symptoms, and internal or external biases.
Inclusive reach. In the same vein, the passive surveillance allows for an inclusive reach irrespective of socioeconomic status (like the inability to afford PCR or antigen testing). Eighty-five percent of the U.S. population has a piped sewer connection that could be sampled. (Though a growing field, current SARS-CoV-2 surveillance remains mostly limited to urban areas.)
Flexibility. There doesn’t have to be a certain place the wastewater needs to be sampled. Samples can be collected anywhere between the toilet and wastewater treatment plant, which allows for a great deal of flexibility for research teams.
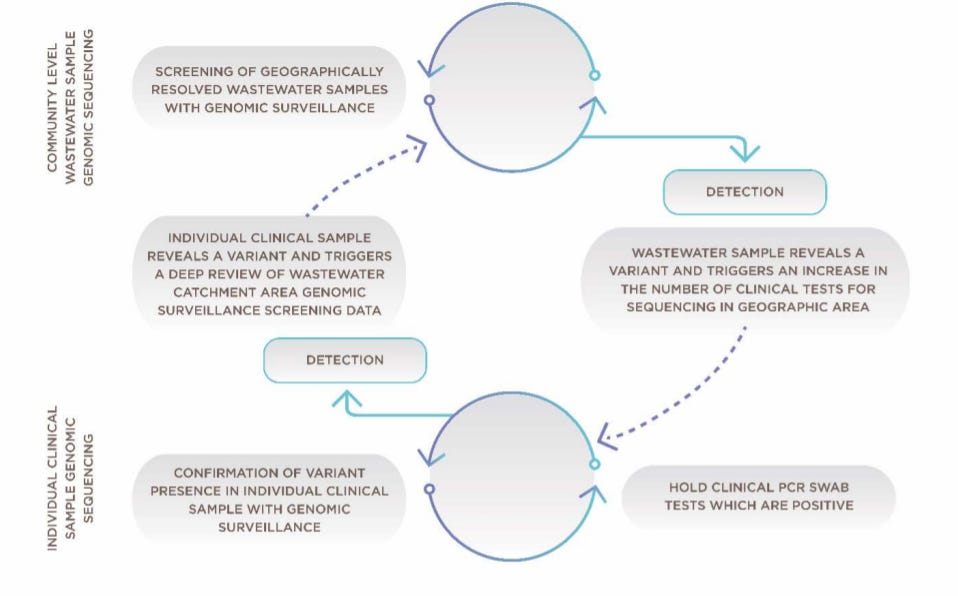
Timely genomic sequencing. Wastewater can also be tested for the type of variant (genomic sequencing). So we can watch Delta and Omicron, for example, spread in close to real time. This is an advantage over sequencing tests among patients, which often see delays in clinical samples and small sample sizes. WBE can have sequencing results within 5 days to better help local public health officials.

Framework for combining community wastewater genomic surveillance with state clinical surveillance. Source Here Public support. Lastly, and maybe most importantly, is that public health and sewers are about people, not just numbers. A group of Louisville scientists conducted a survey in August 2021 to assess wastewater awareness and privacy concerns. They found that awareness of tracking the virus in sewers was low. But, most participants, regardless of sex or race/ethnicity, strongly supported the public disclosure of monitoring results.

But no system is perfect. WBE has its limitations, too:
Supplement. Wastewater data should always be used in addition to, not as a substitute for, clinical testing data. There is no consensus on a direct comparison between wastewater SARS-CoV-2 concentration and clinical case numbers, only that they indicate similar trends. So, wastewater contributes to the holistic view of a virus’s spread across a community and around the world.
Variability. The other limitation is that fecal shedding rate is highly variable across individuals. In a recent meta-analysis, scientists pooled 35 studies to evaluate the prevalence and shedding of SARS-CoV-2 RNA among patients. They found that between 34% and 52% of COVID-19 infected patients shed SARS-CoV-2 in their feces. In addition, shedding of fecal RNA lasted more than 3 weeks after presentation and a week after last detectable respiratory RNA.
Symptomology matters. Most interesting to me is that patient symptoms influence numbers. For example, patients with GI symptoms have three times higher detectable fecal RNA than people with no GI symptoms. This may have important implications for surveillance if this virus continues to shift disease pathways like it did from Delta to Omicron.
Bottom Line: There is no doubt that wastewater surveillance continues to strengthen our public health system, as it brings greater equity in an anonymous, passive, bias-free, acceptable to the public way. I really hope to see our wastewater surveillance grow as a result.
Love, YLE and Dr. Rochelle Holm
Dr. Rochelle Holm is an Associate Professor in the Christina Lee Brown Envirome Institute at the University of Louisville. Her research focuses specifically on wastewater surveillance. She helped gather a lot of the evidence discussed in this post to ensure a comprehensive look at WBE.
“Your Local Epidemiologist (YLE)” is written by Dr. Katelyn Jetelina, MPH PhD—an epidemiologist, biostatistician, professor, researcher, wife, and mom of two little girls. During the day she has a research lab and teaches graduate-level courses, but at night she writes this newsletter. Her main goal is to “translate” the ever-evolving public health science so that people will be well equipped to make evidence-based decisions. This newsletter is free thanks to the generous support of fellow YLE community members. To support the effort, please subscribe here:


Tremendous overview ! I'm so proud that the Metropolitan Council here in the Mpls-St Paul metro area, in partnership with the University of Minnesota, started this testing program many weeks ago. Only recently were our data revealed for public viewing. Sewage analysis is a terrific "tool in the pandemic tool bag" and just clever as hell in its simplicity, selectivity, and sensitivity. As some of us have opined locally, "Unless many people are driving across our borders into Wisconsin or Iowa to have all their bowel movements, we have a good handle on CHANGES in the magnitude of viral RNA shedding from a big portion of Minnesota's 5.6 million population. It's the changes over time and not "absolute viral particle concentrations per se" that are the useful data. Thanks for showing our plot as an example -- we may have lousy winter weather and an NFL team that's never won the Super Bowl, but we do have first-rate sewage analysts. And . . . . our plot is obviously and definitely encouraging now.
Thanks again for another informative post! Perhaps for a future topic, do we have any data (from other countries maybe) on omicron-omicron reinfection? Not sure we can hope for info on the new subvariant yet. (speaking from the perspective of an academic teaching a large enrollment class soon and a mom of an under-5 kid who brought us omicron last month....) Since indoor mask mandates will apparently be lifting very soon, it would be helpful to have an idea of when to brace for more childcare closures and disruptions.