
Your National (U.S.) Report: Feb 12, 2021
Your National (U.S.) Report: Feb 12, 2021
And things are looking good and bad.

Well, things are looking good and bad.
Cases… are nose diving. Our 7-day average is now the same as it was on November 1. Today, cases in 39 states are decreasing and 12 states are plateauing. No states are increasing. However, since my last update, more states are moving from the “falling” category to the “staying the same” category. We want to keep an eye on this.

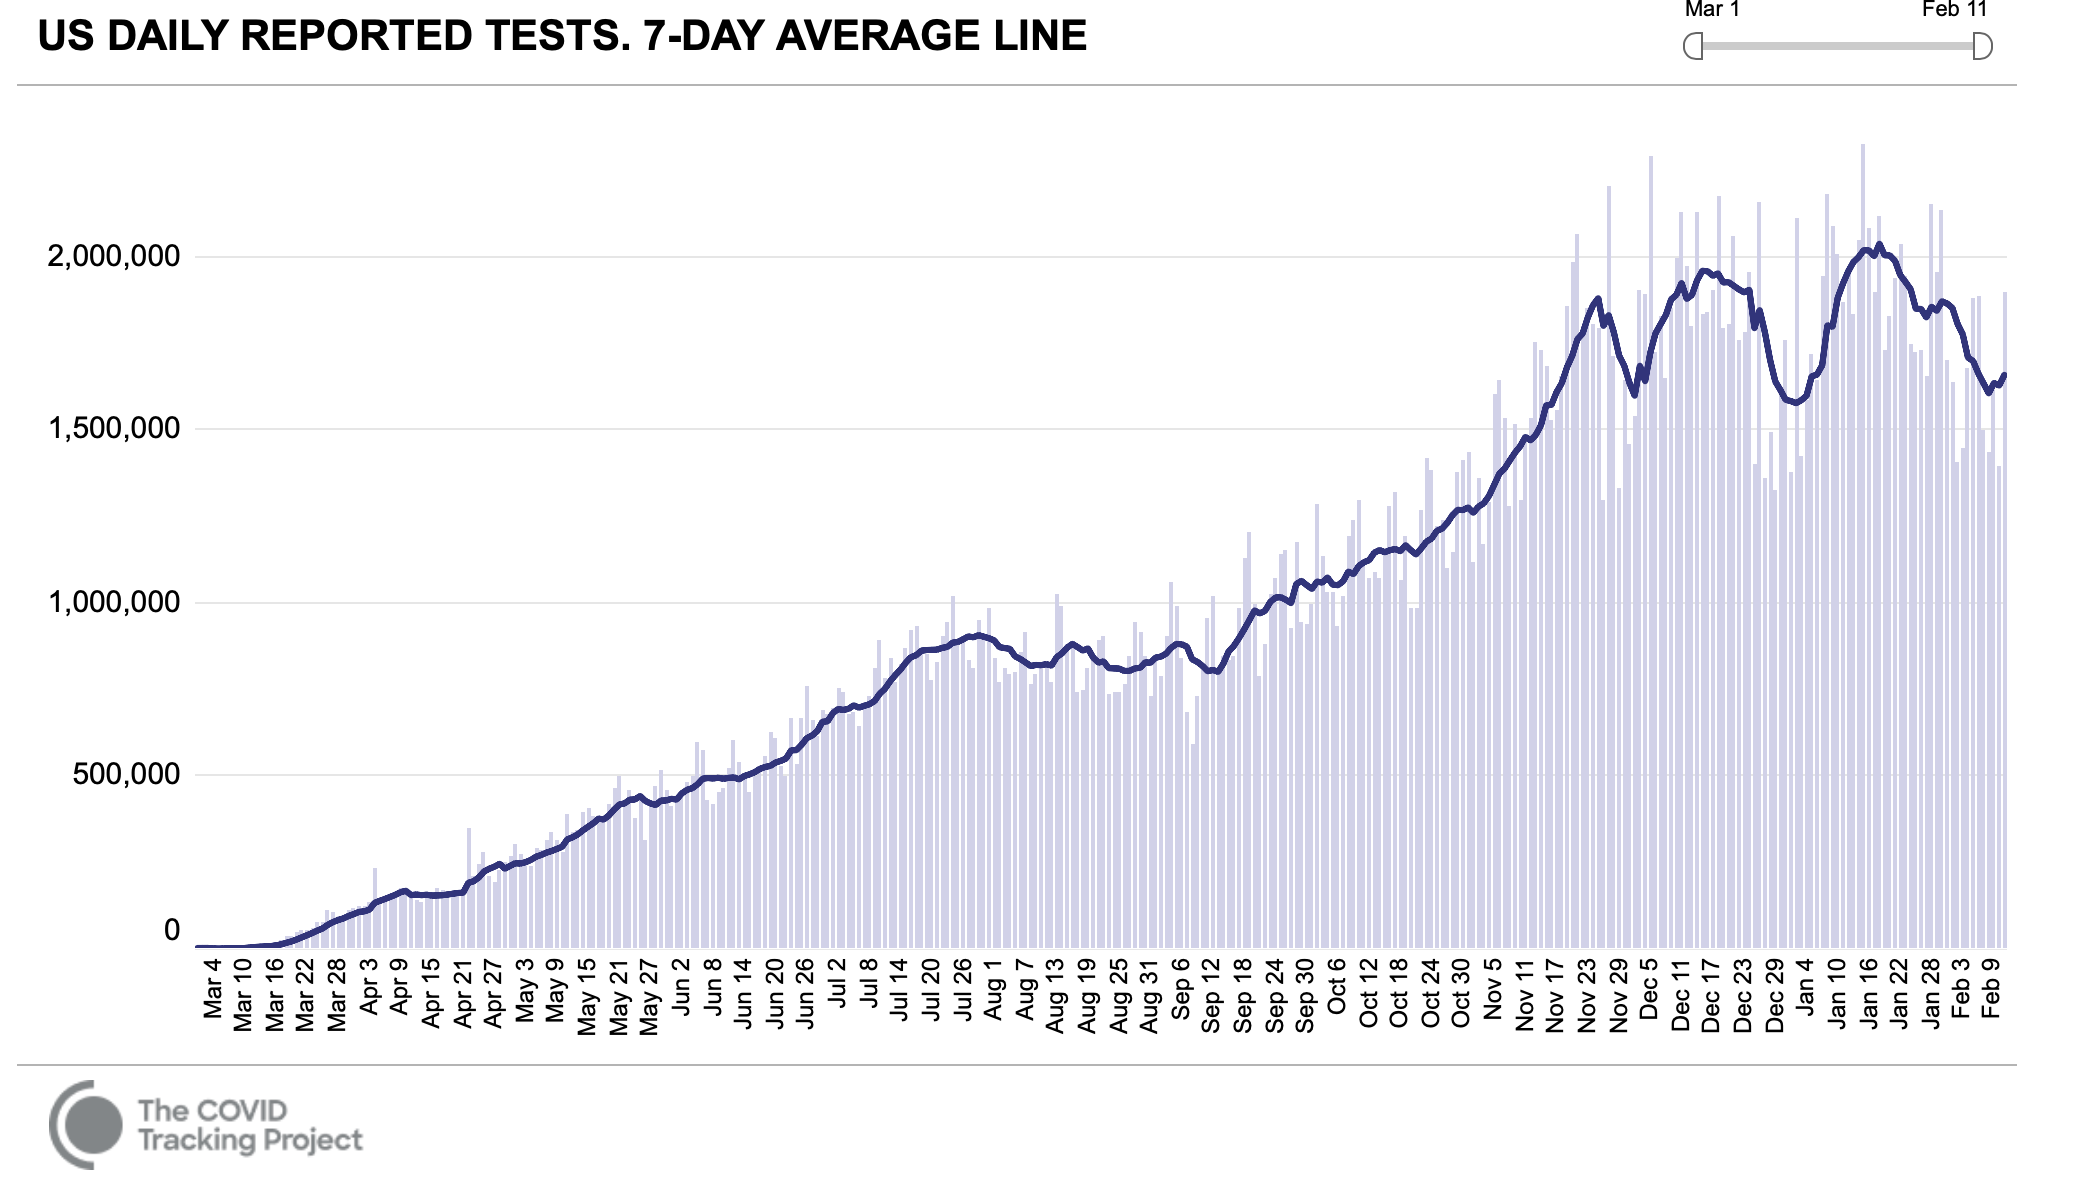
Testing... is starting to decelerate. This is worrying quite a few epidemiologists. Even though demand may be decreasing, we NEED to keep testing up in order to stay ahead of this pandemic. Public health is effective when it’s proactive, NOT when it’s reactive.
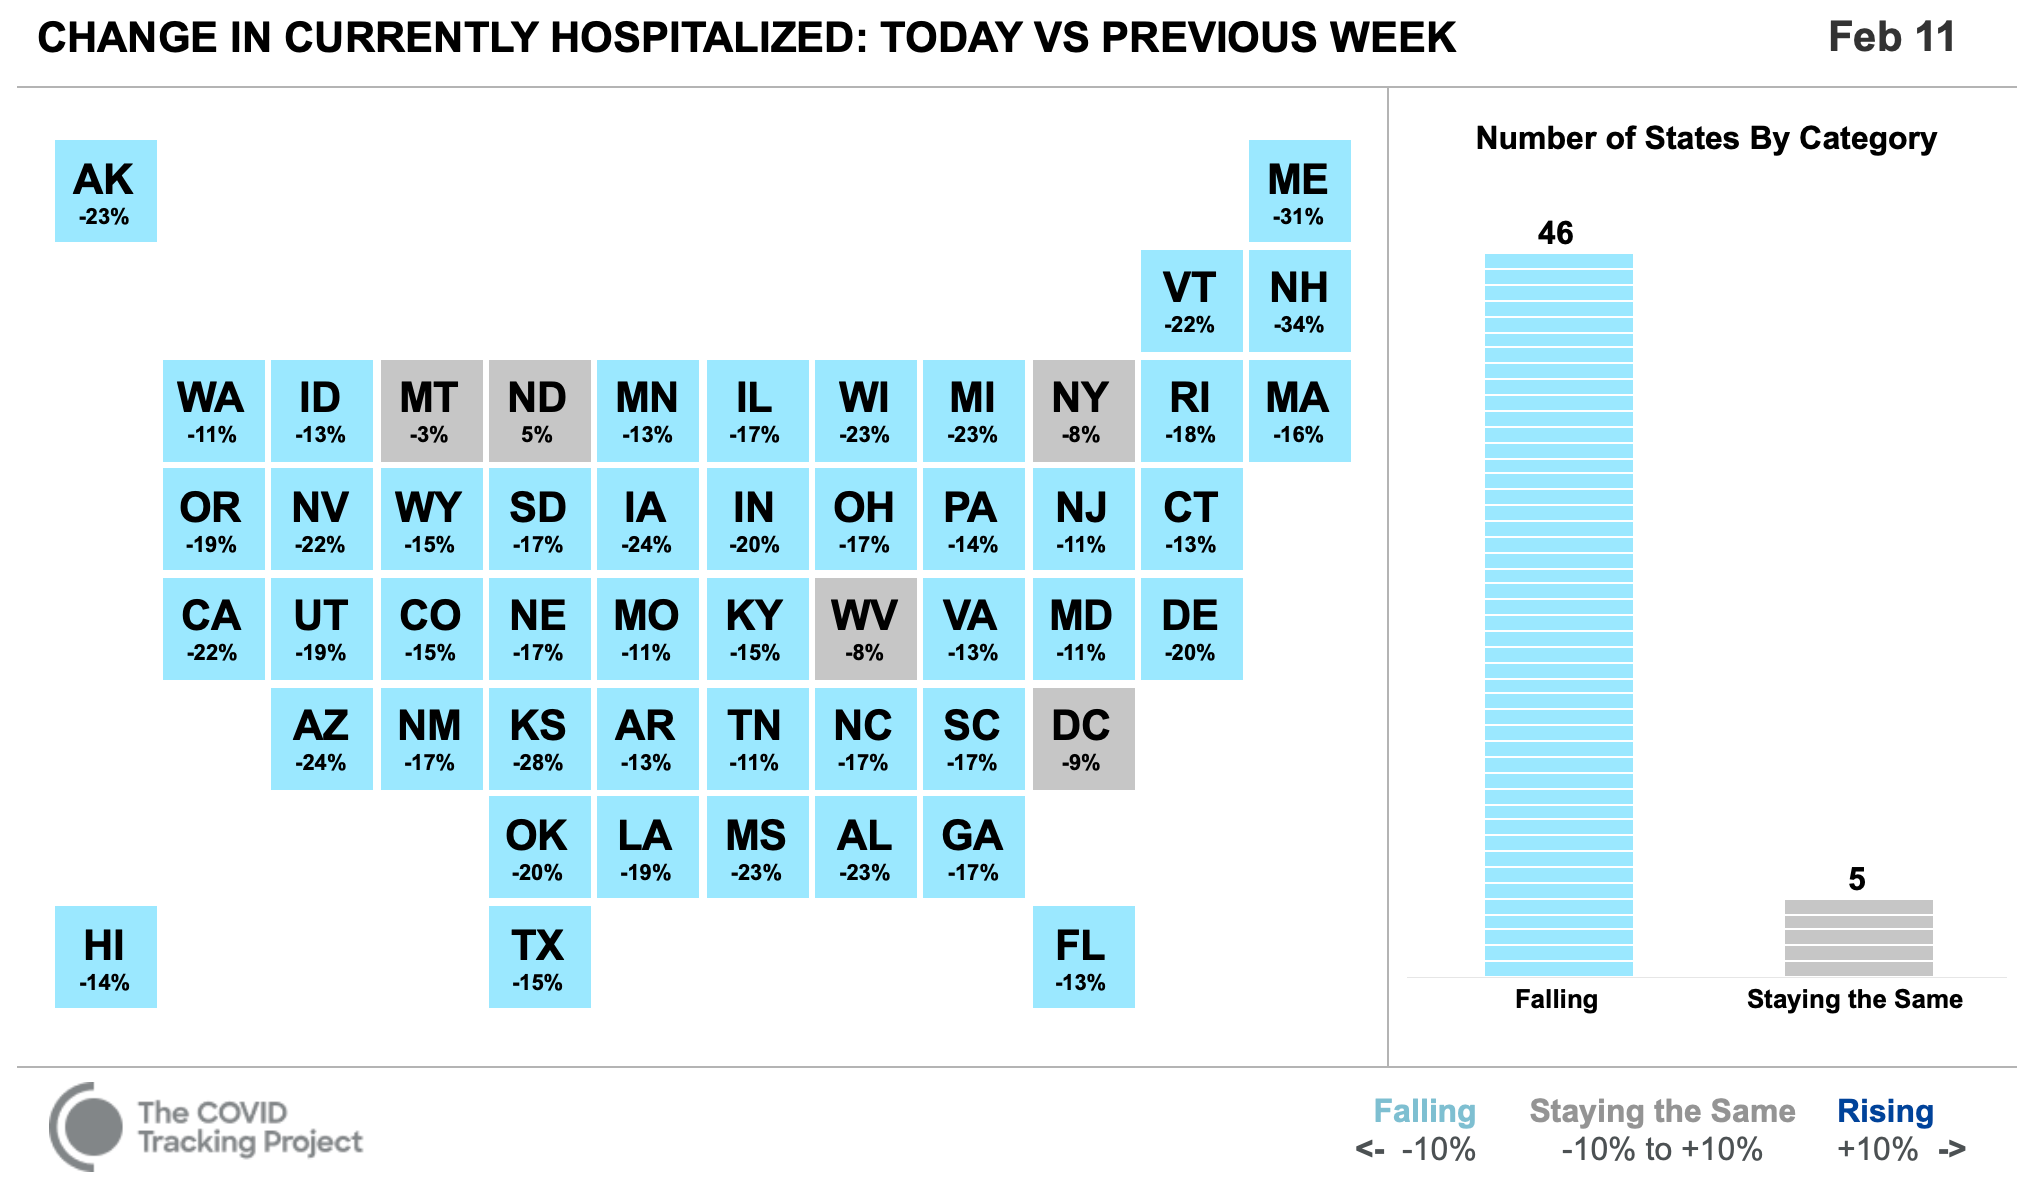
Hospitalizations...are tanking too. 46 states are decreasing and 5 states are plateauing. This is my first “report” where we don’t have any states increasing in hospitalizations! Yesterday, 74,225 people were on hospital beds for COVID19. We are STILLL higher than the peak in April (59,779) and July (59,718).

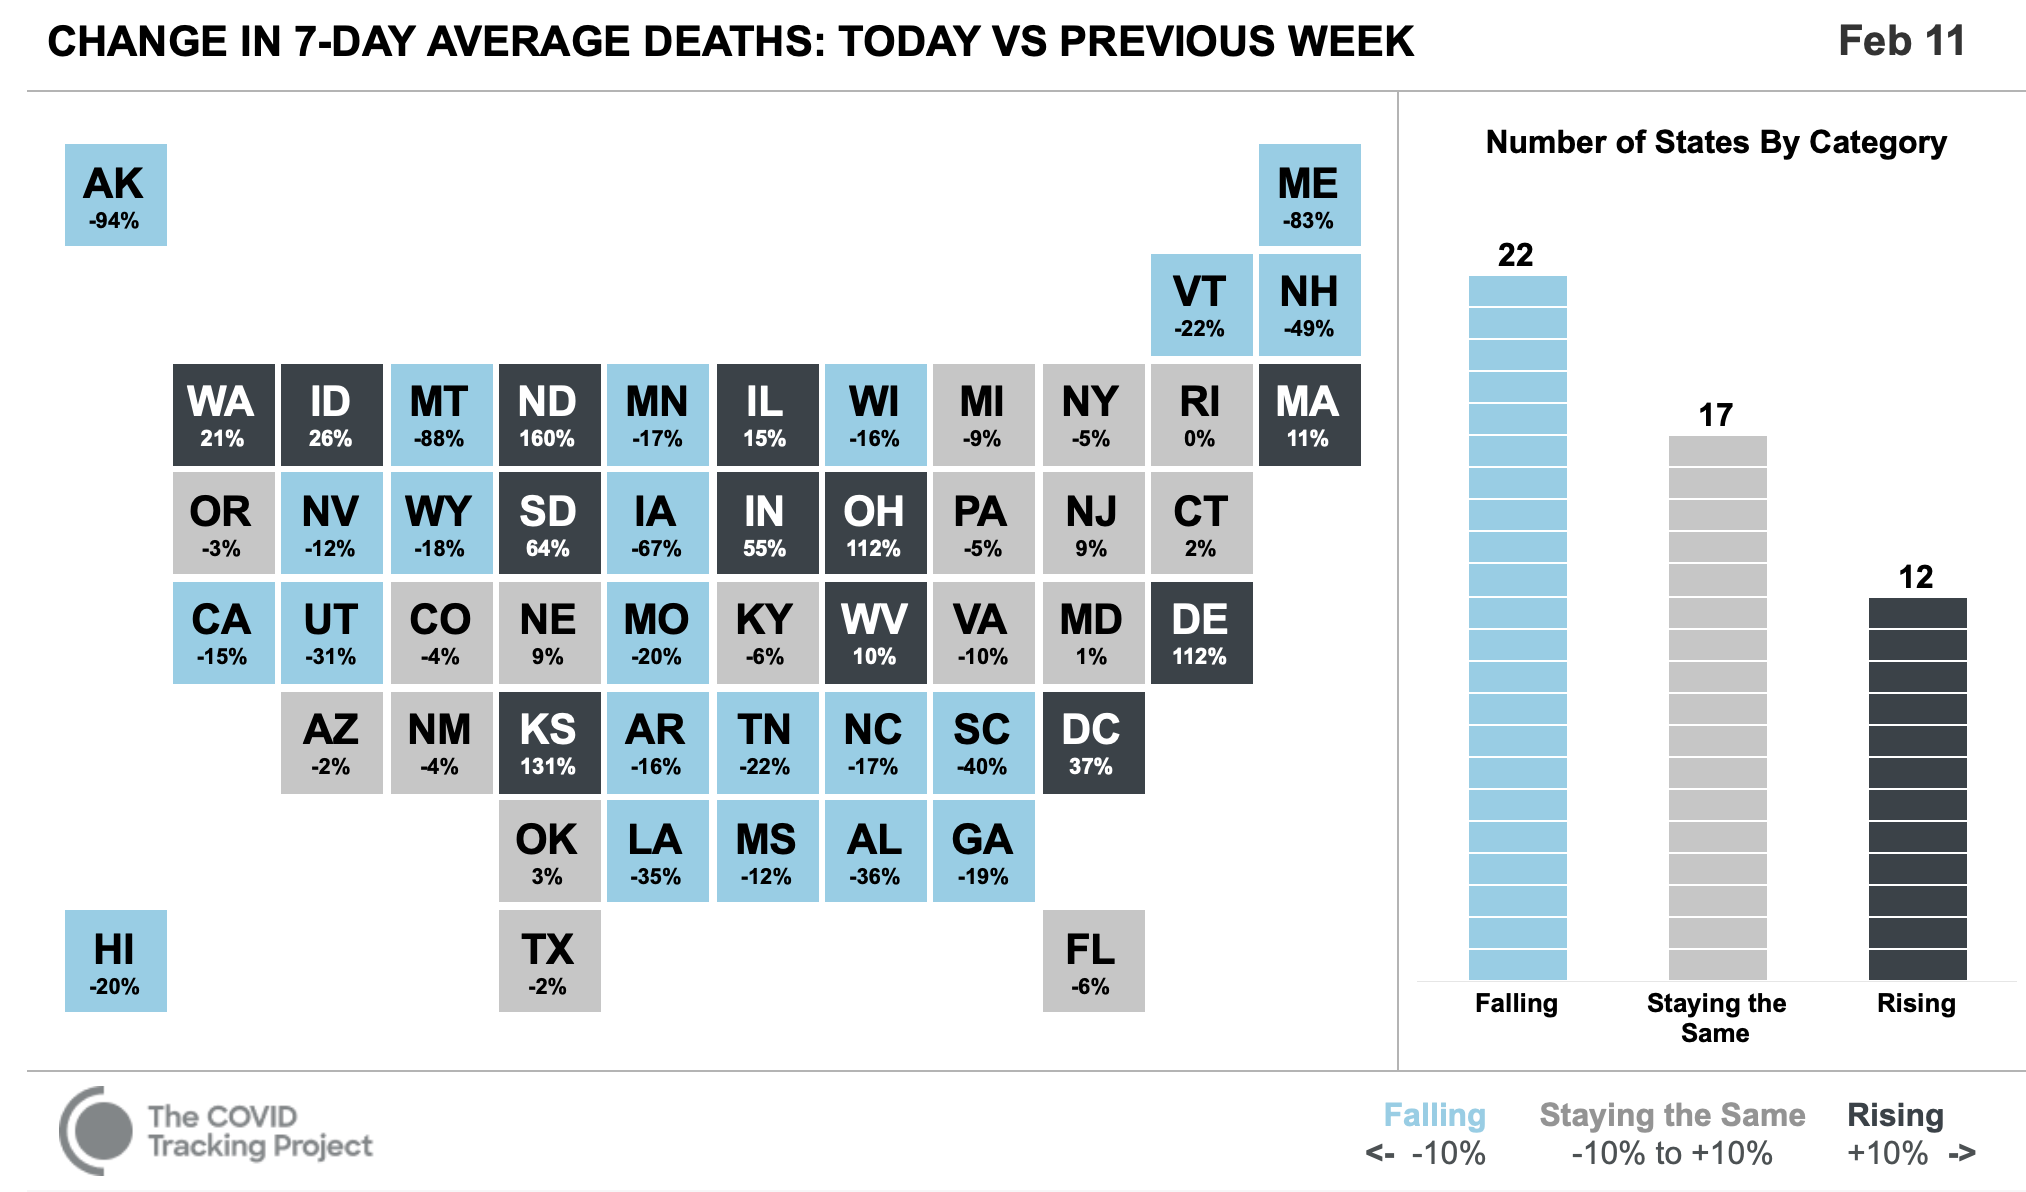
Deaths... are still, unfortunately, catching up. 22 states have decreasing deaths, 17 states are plateauing, and 12 states are increasing. The highest increase in deaths is North Dakota, closely followed by Kansas and Ohio. Yesterday 3,885 souls succumbed to COVID19. In one day. This is STILL higher than souls lost on 9/11. Incredible. We are still predicting a total tally of 500,000 deaths by end of February.
Vaccinations... are starting to exponentially increase as more and more systems are initiated and managers are starting to understand what works and doesn’t work. So far, 48 million doses have been administered (an average of 1.62 million doses per day). At this rate, it will take an estimated 9 months to reach herd immunity (at a threshold of 75%). Alaska continues to lead with 22.9 doses administered per 100 people. This is followed by New Mexico (13 per 100) and West Virginia (11 per 100). Idaho, you’re NOT last anymore! Kansas takes the cake, with administering 8.5 doses per 100 people. (Texas you’re still close to the bottom too, at 9.5 per 100 people).
Variants... are gaining speed, with a doubling rate of 10 days.
B.1.1.7 variant: 981 cases across 37 states
B.1.351 variant: 13 cases in 5 states
P.1: 3 cases in 2 states
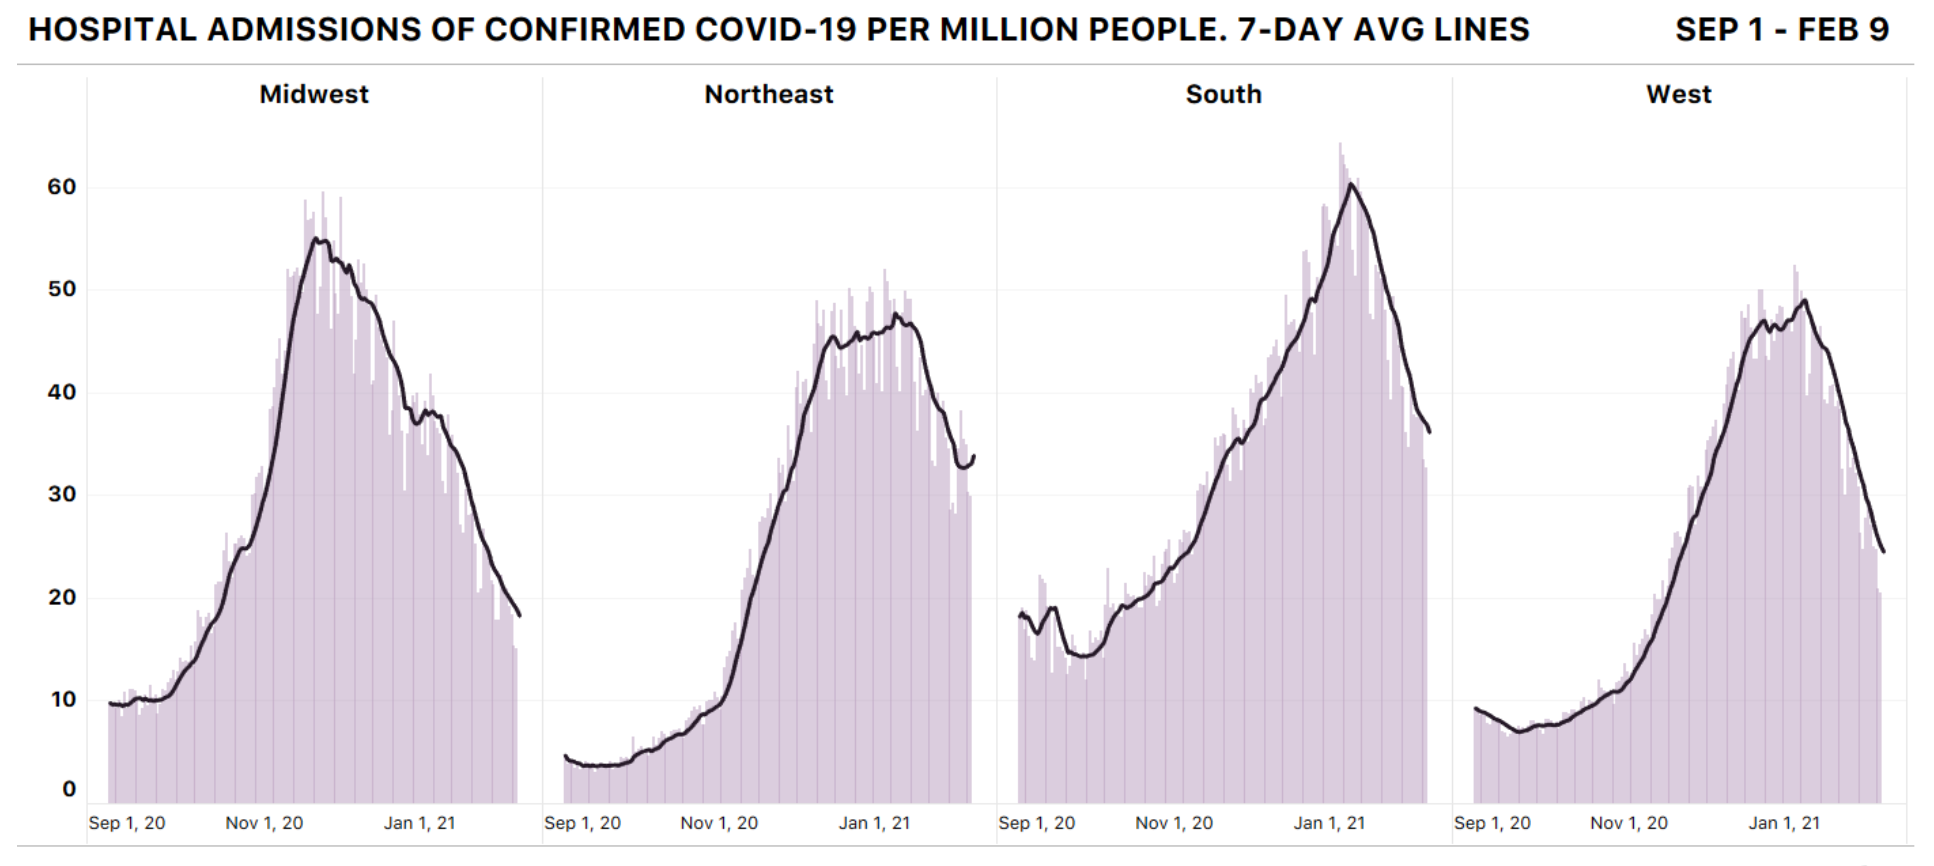
Areas of concern… I (and others) are watching the Northeast closely. Admissions data is starting to increase, which is typically an indicator of a worsening situation. This increase is being driven by NY, NJ, CT and VT, specifically. NY also has the highest (per population) number of hospitalizations and hospitalizations aren’t falling as rapidly as they have in the recent hotspot states. I’m hoping this isn’t an early reflection of B.1.1.7 spread, but it may be. Keep an eye on this area in the next week or two.
Stay vigilant!
Love, YLE
Nine months from when we started, or nine months from now?
Hi, and thank you for this wonderful resources and all your hard work!! My understanding is that the current numbers are all a temporary dip before the next (and biggest and last) surge is likely going to happen due to the variant/s (the UK one that is doubling every ten days in US), in about 6-12 give or take weeks or so. I'm grateful for any dip OF COURSE, but Michael Osterholm sees this as the calm before the category five hurricane is approaching. I'm interested to know if you see it differently.